
Home › Research › Windows 11 Adoption Statistics: Who Upgraded, Who Can't (2026)
Research data
Statistics on Windows 10 and Windows 11 Adoption: Who Upgraded, Who Can't, and What Happens Next
How many PCs run Windows 11 and Windows 10 by month, country and sector, how many cannot upgrade, what users plan, and ESU terms. Sources checked 2026.
Key Windows 11 adoption statistics
- 71.4% of Windows desktop web traffic worldwide came from Windows 11 in September 2026, and 27.8% from Windows 10.
- Windows 11 had 1 billion users by January 2026, the first official user count for it.
- Steam gamers moved first: 49.2% ran Windows 11 in August 2024, the month it overtook Windows 10 among them.
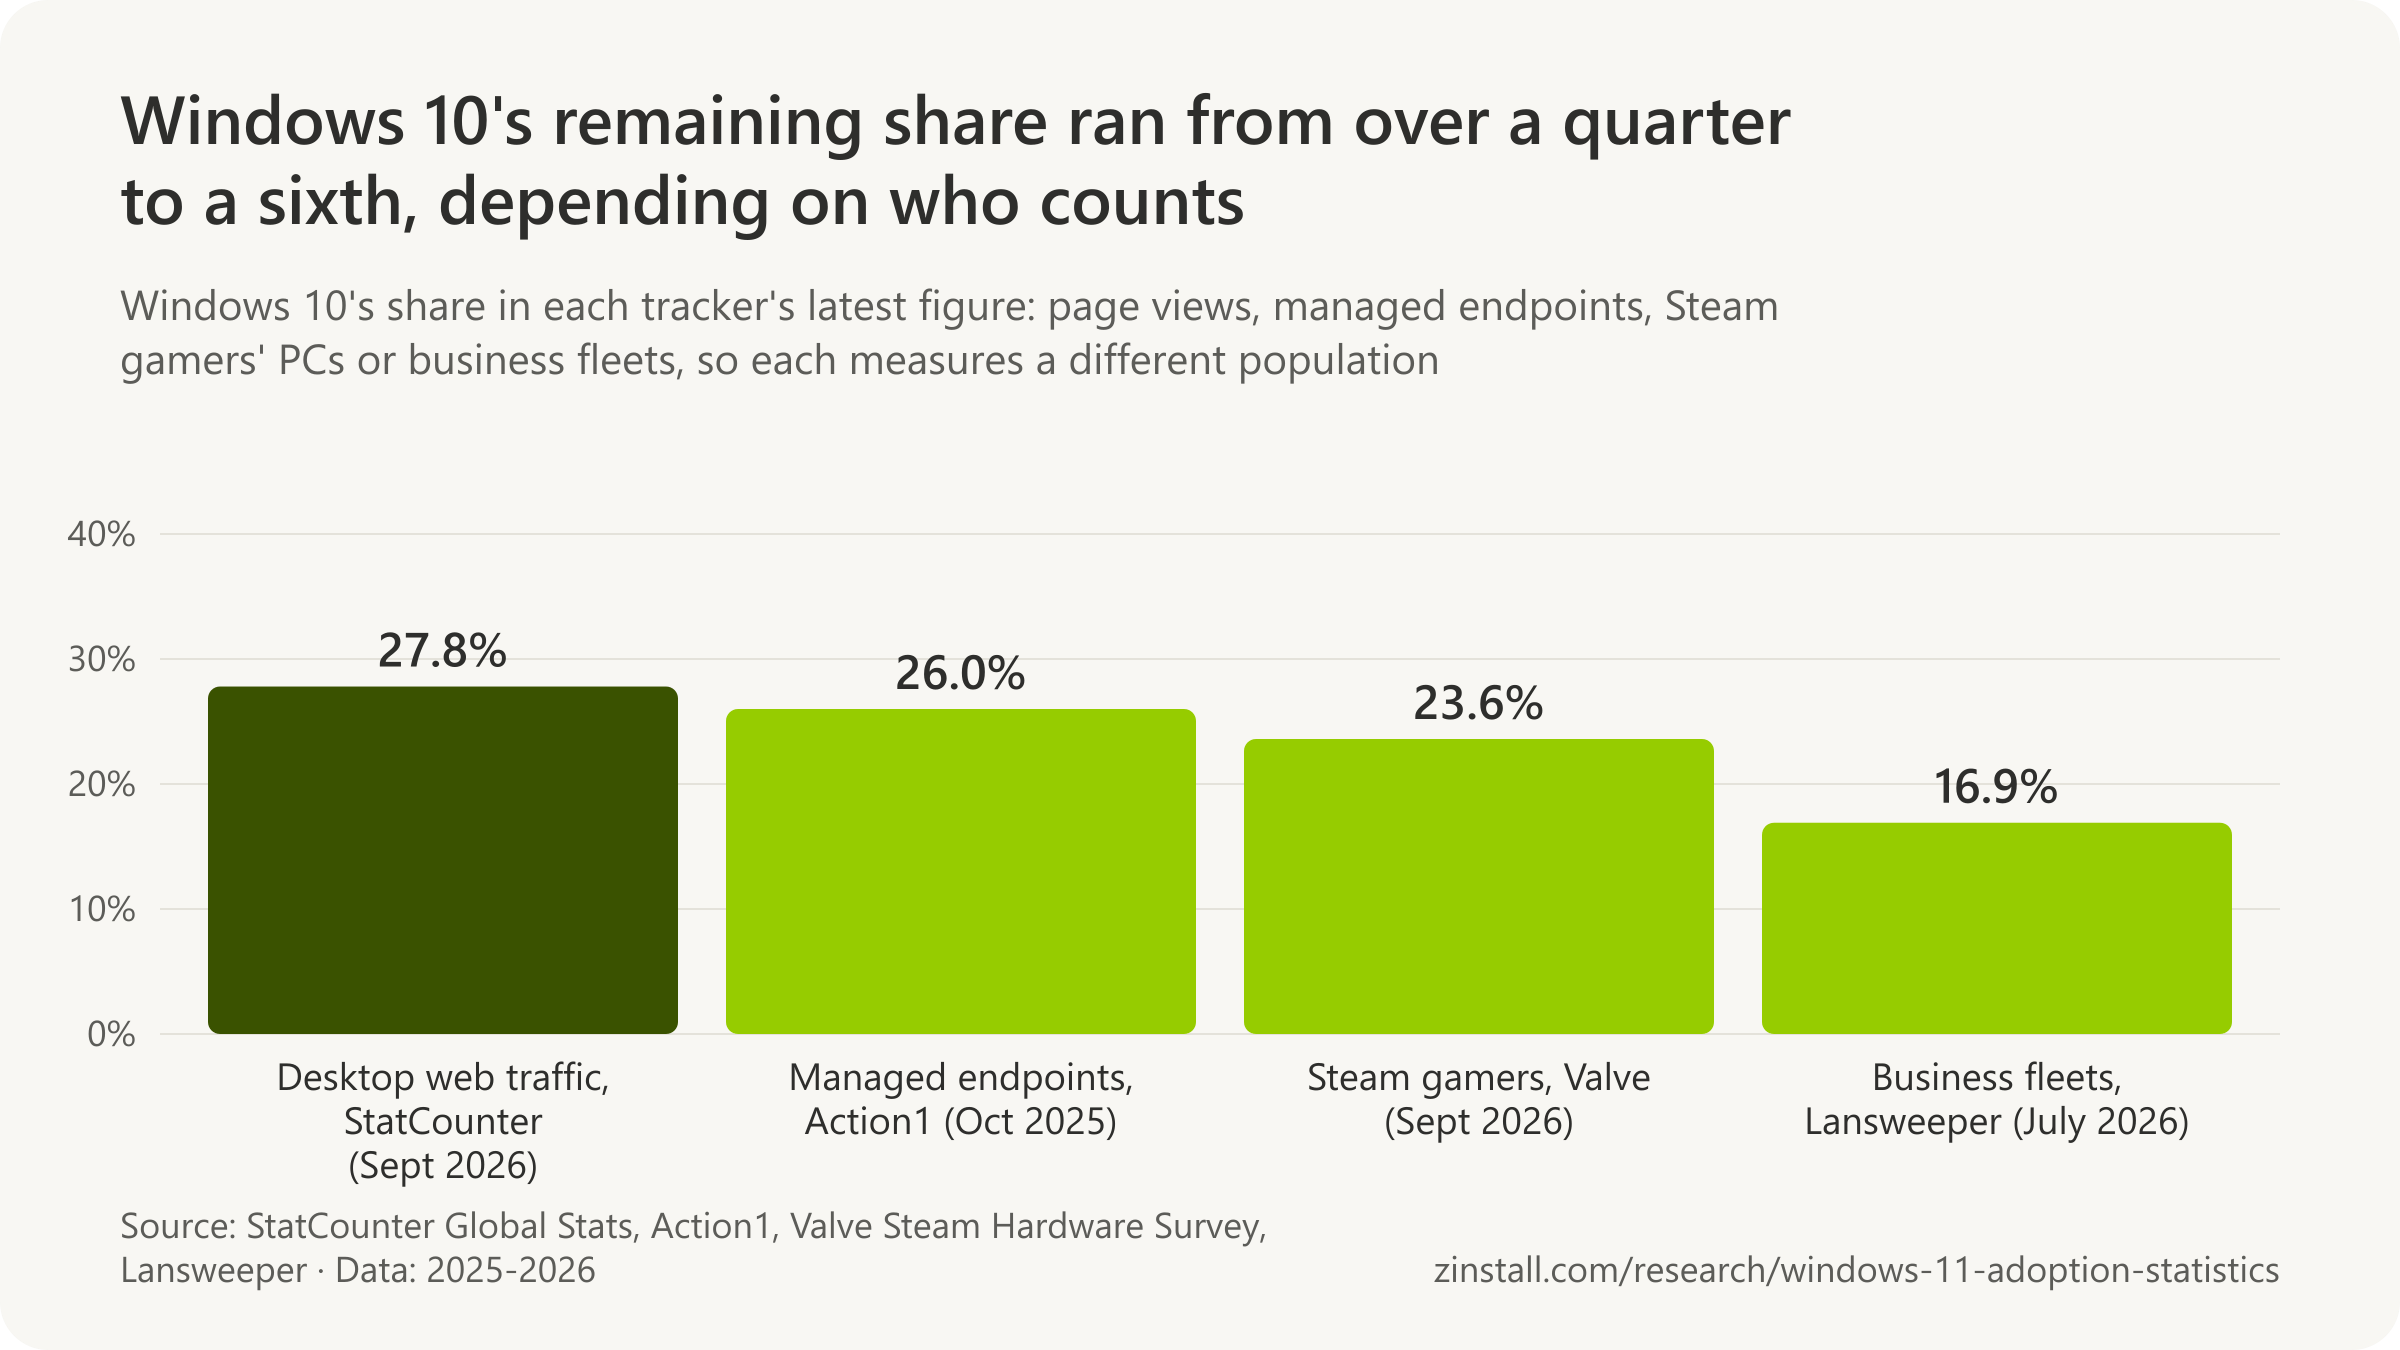
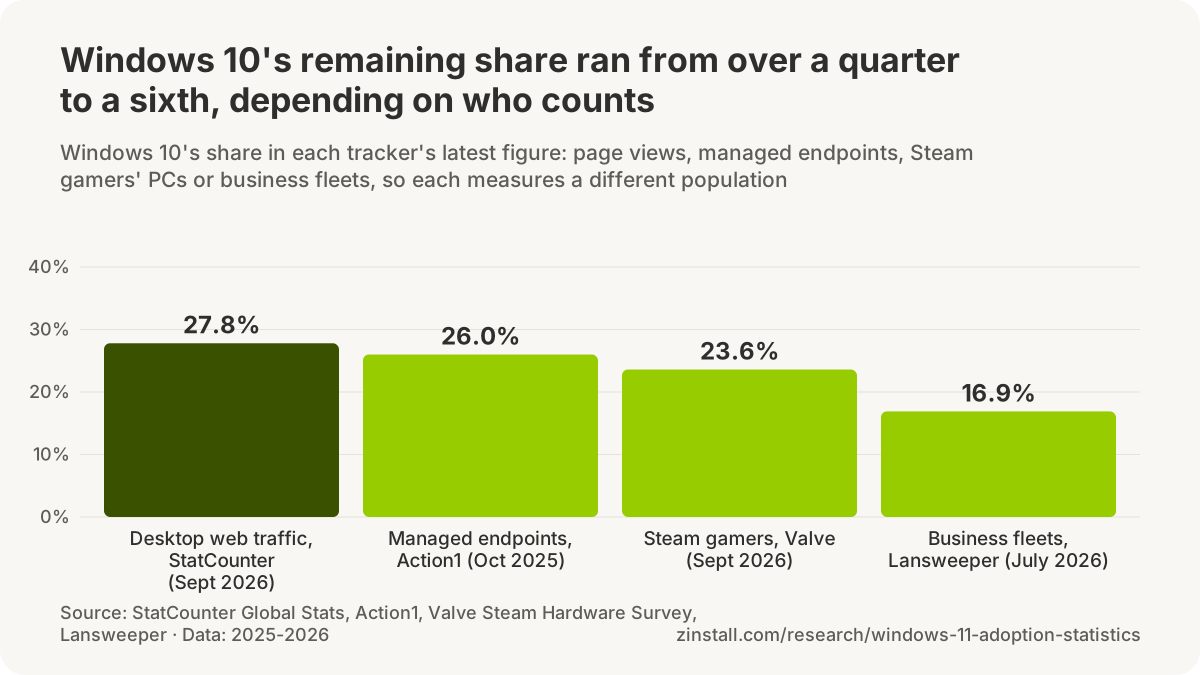
- In business fleets, 16.9% of Windows PCs still ran Windows 10 in July 2026, about one machine in six.
- In Germany, 48.5% of home Windows PCs still ran Windows 10 in January 2026, about 21 million devices.
- 500 million PCs in use are too old to run Windows 11, out of about 1.5 billion, one PC maker estimated (2025).
- In the UK, 26% of Windows 10 users planned to keep using it without security updates, about 5.4 million people (2025).
- Consumers can buy a year of Windows 10 security updates for $30 one time, covering up to 10 devices (2026).
Sources: StatCounter; Microsoft (2026a, 2026b); Valve; Lansweeper; ESET Deutschland GmbH; Dell Technologies; Which?
A year after Microsoft stopped supporting Windows 10, hundreds of millions of computers are still running it, some because their owners have not got round to upgrading and some because the hardware cannot. This page gathers what the trackers, the fleet audits, the surveys and the companies themselves report about Windows 10 and Windows 11: how many PCs run each version, month by month and country by country; who moved first; how many machines cannot make the move; what their owners say they will do; what the extended security updates cost; and what the refresh has meant for the PC market. Every share is a share of Windows PCs as measured by the tracker named beside it, not of all computers.
How many PCs still run Windows 10, and how many run Windows 11?
71.4% of Windows desktop web traffic worldwide came from Windows 11 in September 2026, and 27.8% from Windows 10 (StatCounter, 2026).

- Windows 11 had 1 billion users by January 2026, the first official user count for it (Microsoft, 2026).
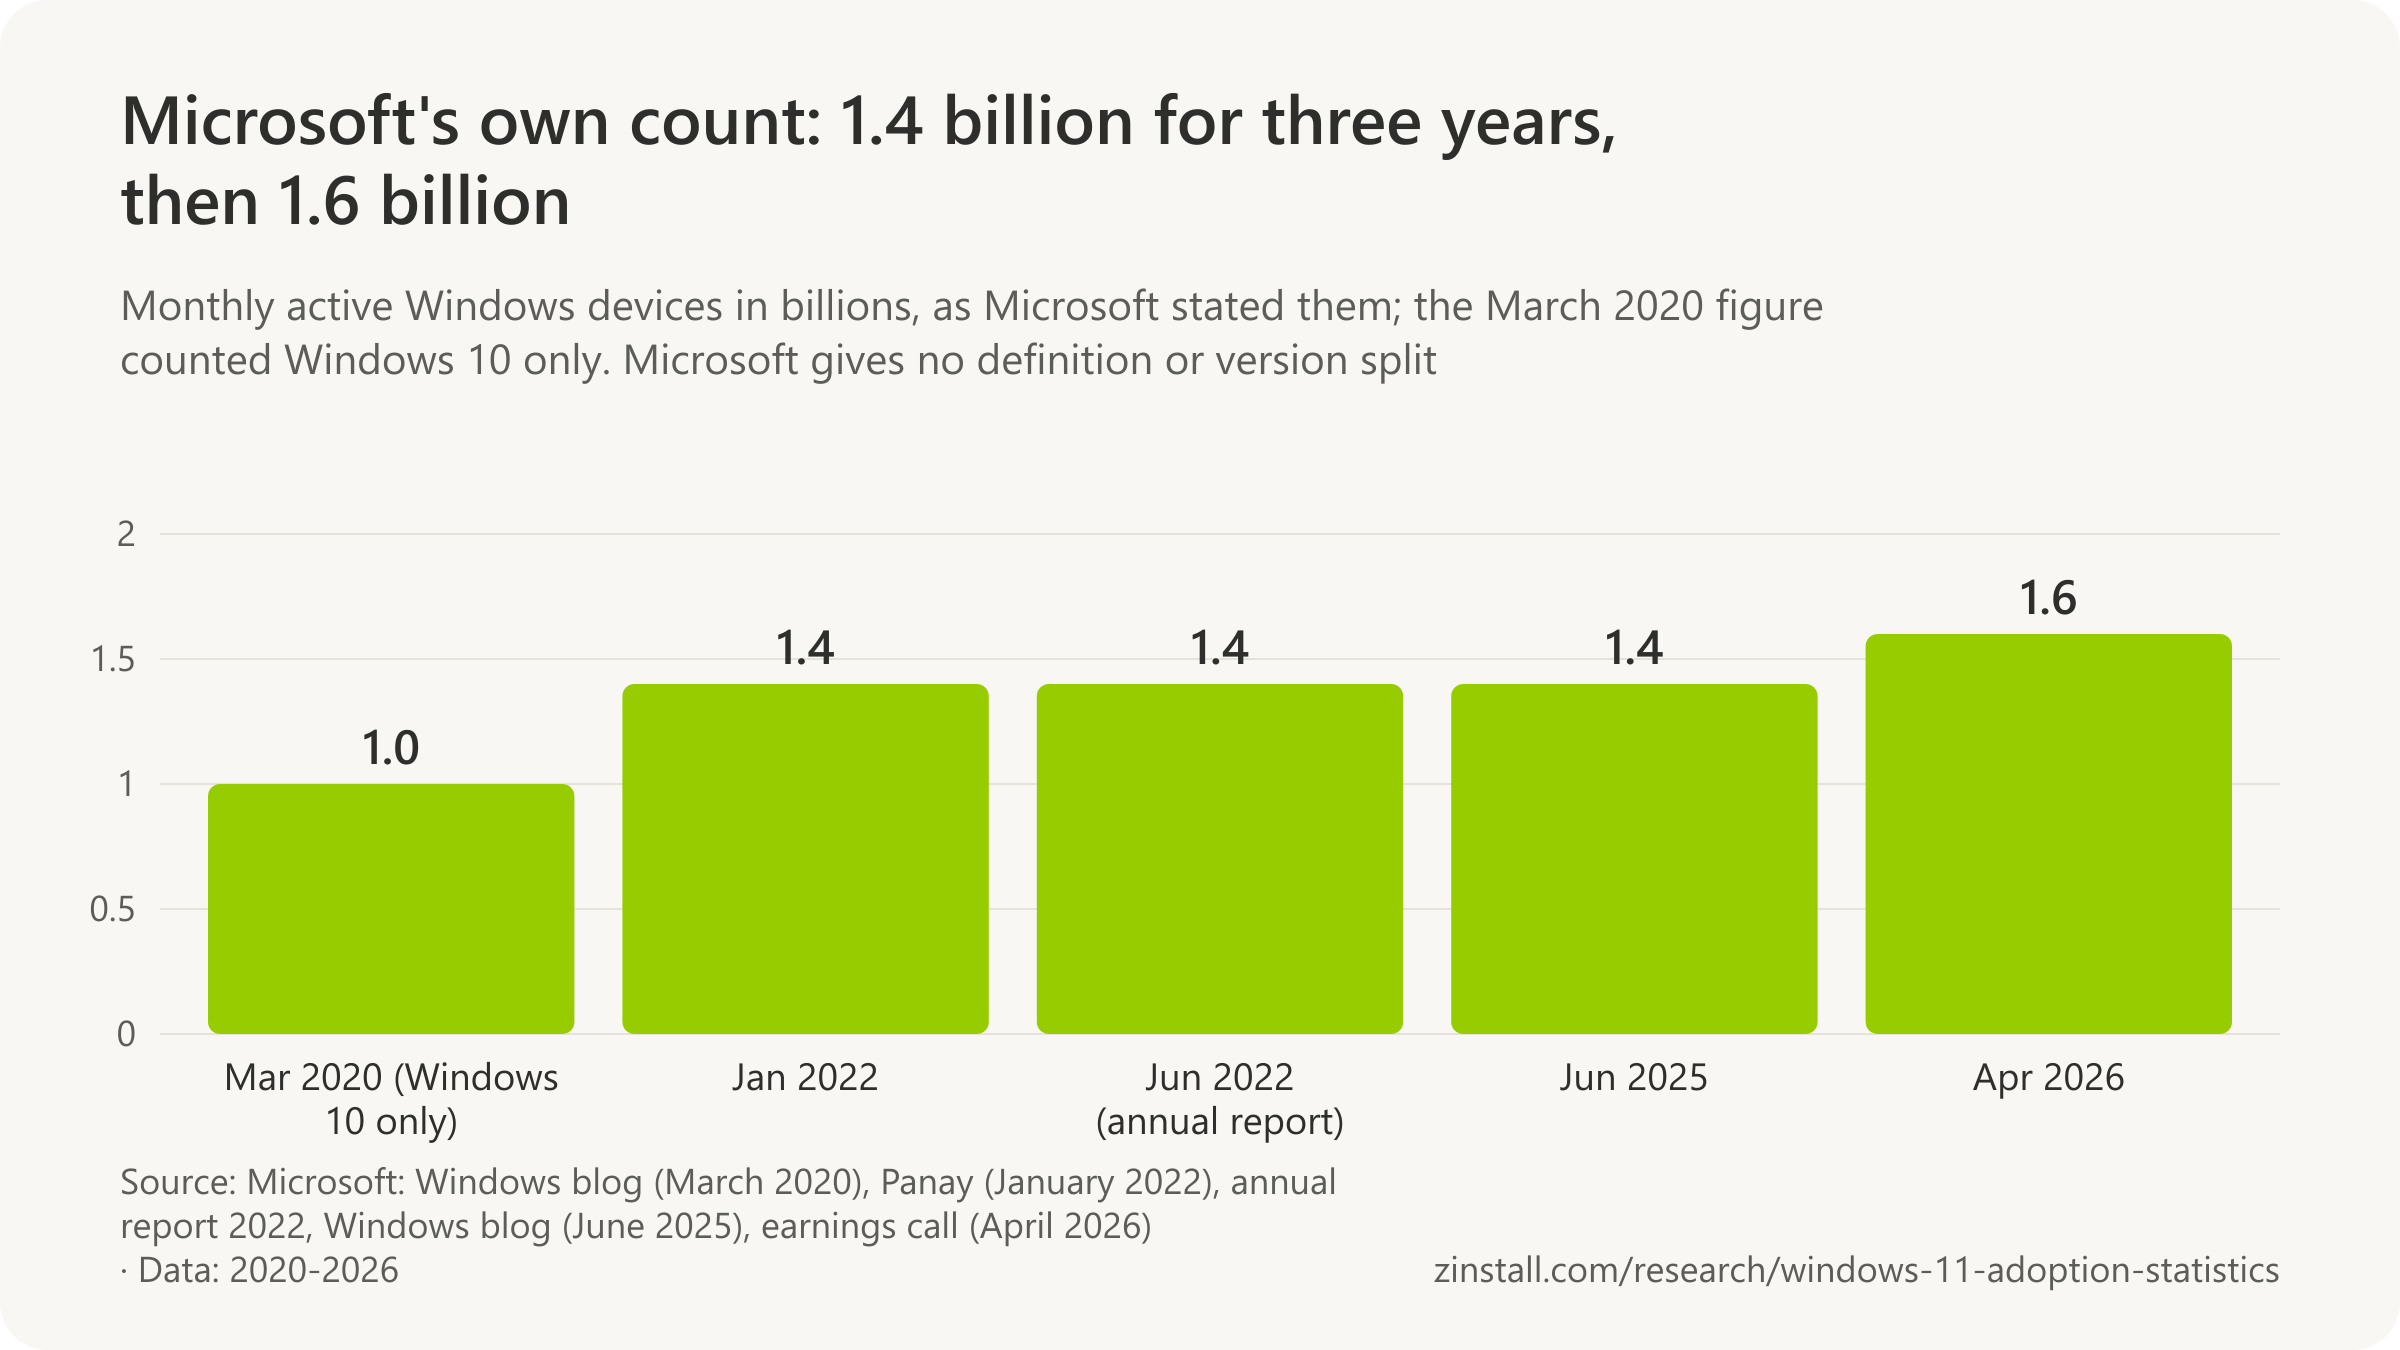
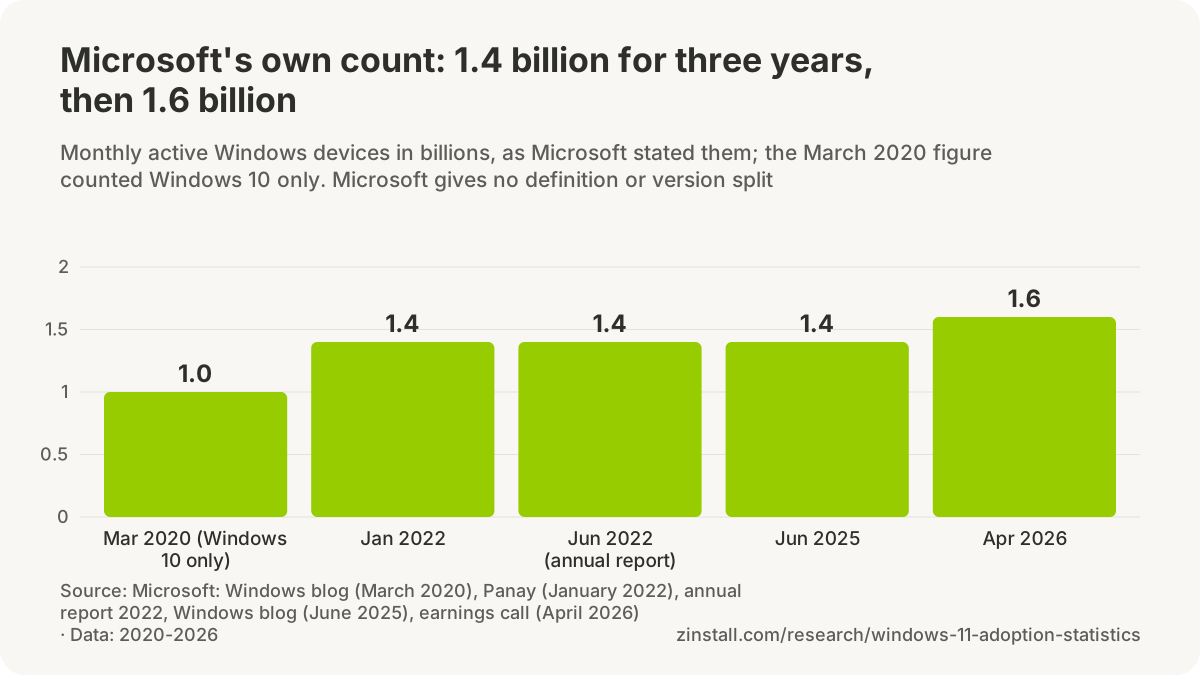
- Microsoft put all monthly active Windows devices at 1.6 billion in April 2026.
- Among Kaspersky's users, 53% still ran Windows 10 in September 2025, a month before support ended, and 33% Windows 11.
- An analyst estimate put 550 million Windows PCs in corporations and said about half would miss the October 2025 deadline.
| Tracker, population and month | Windows 10 share |
|---|---|
| StatCounter, desktop web traffic worldwide, September 2026 | 27.8% |
| StatCounter, all platforms worldwide, September 2026 | 27.8% |
| Valve, Steam survey participants, September 2026 | 23.6% |
| Action1, managed Windows endpoints, October 2025 | 26% |
| ControlUp, business machines yet to migrate, late October 2025 | 21% |
| Lansweeper, business fleet devices, July 2026 | 16.9% |
| TeamViewer, endpoints receiving remote support, July to September 2025 | 40%+ |
| Kaspersky, corporate devices in its telemetry, September 2025 | 59.5% |
Sources: StatCounter (2026a, 2026b); Valve; Microsoft (2026a, 2026b); Kaspersky; The Register; Action1; ControlUp; Lansweeper; TeamViewer SE
More statistics (61)
71.4% of Windows desktop page views worldwide came from Windows 11 in September 2026, against 27.8% from Windows 10 (StatCounter, 2026).
Three kinds of tracker answer this question, and they count different things. StatCounter samples page views from Windows desktop devices across the sites that carry its code; Valve's Steam survey asks gaming PCs that opt in; Lansweeper, ControlUp and Action1 audit the managed fleets of their business customers. The figures below name the tracker and the month, and the note at the end of the section explains why they differ.
- 27.8% of Windows desktop page views worldwide still came from Windows 10 in September 2026, eleven months after its end of support (StatCounter, 2026).
- 99.3% of Windows desktop page views worldwide came from Windows 10 or Windows 11 in September 2026 (StatCounter, 2026).
- 71.4% of Windows page views worldwide across all platforms came from Windows 11 in September 2026 (StatCounter, 2026).
- 71.3% of Steam survey participants ran Windows 11 (64-bit) in September 2026, up 0.4 points on August, against 23.6% on Windows 10 (Valve Steam Hardware and Software Survey, 2026).
- 23.6% of Steam survey participants still ran Windows 10 (64-bit) in September 2026, up 0.7 points on August (Valve Steam Hardware and Software Survey, 2026).
- 78.8% of Windows client devices in Lansweeper's customer fleets were running Windows 11 by July 2026 (Lansweeper, 2026).
- 16.9% of Windows client devices in Lansweeper's customer fleets, about one machine in six, were still running Windows 10 in July 2026 (Lansweeper, 2026).
- 21% of business machines in ControlUp's sample had yet to migrate to Windows 11 in late October 2025, per ControlUp's own summary of an IT Brew feature (ControlUp, 2025).
- 26% of Windows endpoints managed through Action1 were still running Windows 10 in October 2025, against 74% on Windows 11, in the vendor's telemetry across the United States, the European Union and Australia (Action1, 2025).
- 53% of all users in Kaspersky Security Network data still ran Windows 10 in September 2025, 33% had moved to Windows 11 and 8.5% of devices remained on Windows 7 (Kaspersky, 2025).
- Over 40% of endpoints worldwide that received support through a TeamViewer session between July and September 2025 still ran Windows 10, from a sample of 250 million connections (TeamViewer, 2025).
- Nexthink estimated about 181 million enterprise Windows 10 devices in September 2025, by applying a 43% Windows 10 market share to an estimated 420 million commercial and public-sector Windows devices (30% of Microsoft's 1.4 billion) (Nexthink, 2025).
- 1.6 billion monthly active Windows devices was the count Satya Nadella gave on Microsoft's fiscal 2026 third-quarter earnings call on 29 April 2026, the highest Windows figure Microsoft has published (Microsoft, 2026).
- 1 billion Windows 11 users were reported by Microsoft CEO Satya Nadella on the fiscal 2026 second-quarter earnings call on 28 January 2026, the first Microsoft-published Windows 11 count (Microsoft, 2026).
- 27.8% of Windows page views worldwide across all platforms came from Windows 10 in September 2026 (StatCounter, 2026).
- 71.5% of Windows desktop page views worldwide came from Windows 11 in September 2026 according to the CSV export behind StatCounter's chart (StatCounter, 2026).
- 27.8% of Windows desktop page views worldwide came from Windows 10 in September 2026 according to the CSV export behind StatCounter's chart (StatCounter, 2026).
- TechRadar restated Lansweeper's July 2026 finding as 16.9% of Windows client devices, roughly one in six, still running Windows 10 (TechRadar, 2026).
- ZDNet restated TeamViewer's analysis as 41% of devices connecting via Windows 10 in a sample of 250 million sessions between June and September 2025 (ZDNet, 2025).
- Omdia calculated that 550 million of Microsoft's 1.4 billion Windows devices run in corporations and that around half of those would not have switched to Windows 11 by the October 2025 end-of-support date (The Register, 2025).
- Windows Report restated Omdia's figure as roughly 550 million corporate PCs still on Windows 10, with around half not meeting the Windows 11 transition deadline (Windows Report, 2025).
- 76.4% of desktop page views worldwide came from Windows in September 2026, with OS X and macOS together at 16.8% and Linux at 4.5% (StatCounter, 2026).
- 79.9% of desktop page views worldwide came from Windows in September 2025 (StatCounter, 2026).
- Windows' share of desktop page views worldwide fell 3.5 points in twelve months, from 79.9% in September 2025 to 76.4% in September 2026 (StatCounter monthly series, 2026).
| Tracker, population and month | Share | Scope |
|---|---|---|
| September 2026 (latest) | 71.4% | Windows desktop devices (desktops and laptops) in StatCounter's page-view sample · Worldwide · 2026-09 |
| September 2026 (latest) | 27.8% | Windows desktop devices (desktops and laptops) in StatCounter's page-view sample · Worldwide · 2026-09 |
| StatCounter, Windows page views on all platforms worldwide, Windows 11, Sept 2026 | 71.4% | Windows devices on all platforms (desktop, mobile, tablet, console) in StatCounter's page-view sample · Worldwide · 2026-09 |
| September 2026 (latest) | 71.3% | Steam users who took part in Valve's voluntary monthly hardware and software survey · Worldwide · 2026-09 |
| Steam Hardware Survey, participating gaming PCs, Windows 10, Sept 2026 | 23.6% | Steam users who took part in Valve's voluntary monthly hardware and software survey · Worldwide · 2026-09 |
| July 2026 | 78.8% | Windows devices in Lansweeper's HVMND Collective Intelligence data (a subset of millions of assets across tens of thousands of customer sites) · Worldwide · 2026-07 |
| Lansweeper, managed business devices worldwide, Windows 10, July 2026 | 16.9% | Windows devices in Lansweeper's HVMND Collective Intelligence data · Worldwide · 2026-07 |
| Action1, managed Windows endpoints, Windows 10, Oct 2025 | 26% | active Windows endpoints on Action1's patch-management platform in the US, EU and Australia (vendor telemetry, October 2024 to October 2025) · United States, European Union, Australia · 2025-10 |
| Kaspersky Security Network, corporate devices, Windows 10, Sept 2025 | 59.5% | corporate devices among consenting Kaspersky Security Network users · Worldwide · 2025-09 |
| TeamViewer, endpoints needing remote support, Windows 10, Jul-Sep 2025 | 40%+ | Endpoints receiving support in TeamViewer sessions (supportee view), paid and free licences · Worldwide · 2025-07/2025-09 |
What each tracker counts
- 3 billion page views per month from more than 1 million websites is the sample StatCounter says its Global Stats, including its browser and operating system shares, are based on (StatCounter, 2026).
- Page views, not unique visitors or devices, are what StatCounter counts, so a browser that loads 500 pages weighs 500 times one that loads a single page (StatCounter, 2026).
- Laptops and desktops are one 'desktop' platform in StatCounter's data because the browser user agent cannot tell them apart; the platform of every page view is set from the user agent (StatCounter, 2026).
- No weighting is applied to StatCounter's data: shares are the raw proportion of sampled page views, so countries where its code is common count for more (StatCounter, 2026).
- 45 days after first publication is how long StatCounter says each month's figures remain subject to quality assurance testing and revision, after which no changes are made (StatCounter, 2026).
- Valve describes the Steam Hardware and Software Survey as a monthly survey of what hardware and software its customers use, in which participation is optional and anonymous (Valve, 2026).
- Lansweeper's September 2025 Windows 11 adoption figures draw on over 8 million Windows devices scanned in its customers' networks (Lansweeper, 2025).
- ControlUp's June 2025 Windows 11 readiness findings are based on more than one million enterprise Windows endpoint devices under its management as of June 2025 (ControlUp, 2025).
- ESET's German office based its 2025 Windows 10 counts on its own telemetry data, cross-checked against StatCounter, according to dpa (dpa, 2025).
- 5.3 billion page views made up StatCounter's global sample in July 2022, the most recent sample-size statement on its FAQ, with 1 billion from the United States (StatCounter, 2022).
- Bots are identified and excluded from StatCounter's stats, and the company reserves a 45-day window to revise figures and says it flags revisions on its graphs with a note (StatCounter, 2026).
- Third-party visitors to member websites, not StatCounter's own members, are who StatCounter's Global Stats track, which it says minimises bias and gives a random sample (StatCounter, 2026).
- ControlUp's August 2024 Windows 11 readiness figures were compiled from over 750,000 enterprise Windows devices under its management as of early August 2024 (ControlUp, 2024).
- By March 2025 ControlUp's Windows 11 readiness sample had grown from 750,000 to 1,100,000 enterprise Windows endpoints (ControlUp, 2025).
How many Windows devices there are
- 1 billion monthly active devices ran Windows 10 worldwide in March 2020, Microsoft's first version-level device count for Windows 10 (Microsoft, 2020).
- 1.3 billion monthly active Windows devices were reported by Microsoft a year before its 1.4 billion figure, as ZDNET recalled in 2025 (ZDNET, 2025).
- 1.4 billion monthly active devices ran Windows worldwide in January 2022, according to Windows chief Panos Panay's blog post after Microsoft's quarterly results (Microsoft, 2022).
- 1.4 billion monthly active devices ran Windows 10 or Windows 11 in Microsoft's fiscal 2022 annual report shareholder letter, the figure most outlets cite for the Windows installed base (Microsoft, 2022).
- 400 million monthly active devices ran Windows 11 in October 2023, according to internal Microsoft data reported by Windows Central, which also said the figure was on track for 500 million by early 2024 (Windows Central, 2023).
- 1 billion monthly active devices still ran Windows 10 in November 2023, against 400 million on Windows 11, according to Windows Central's reading of Microsoft data (Windows Central, 2023).
- 1 billion ('over a billion') monthly active devices was the Windows count in Yusuf Mehdi's 24 June 2025 Windows 10 end-of-support post as first published, captured by the Wayback Machine the next day (Microsoft, 2025).
- 1.4 billion monthly active Windows devices is the corrected wording of Microsoft's 24 June 2025 end-of-support post, edited about a week after publication from 'over a billion' (Microsoft, 2025).
- 400 million Windows PCs 'disappeared' between January 2022 and June 2025 by Ed Bott's arithmetic (1.4 billion minus 'over a billion'), a reading Microsoft undercut by editing the post to 1.4 billion (ZDNET, 2025).
- 1.4 billion monthly active Windows devices was restored by Microsoft's quiet edit of its June 2025 post, which Windows Central reported as confirming no loss of up to 400 million users (Windows Central, 2025).
- 45% or more year-over-year growth in Windows 11 users was reported by Microsoft on 28 January 2026 alongside the one-billion milestone (Microsoft, 2026).
- 1.6 billion was restated by Thurrott as 'monthly active Windows [PCs]', inserting 'PCs' where Nadella said 'devices', and called the highest Windows usage figure Microsoft has ever provided (Thurrott, 2026).
- 28.6% of the 1.4 billion monthly active Windows 10 and 11 devices would be on Windows 11 if Windows Central's 400 million figure is set against Microsoft's 2022 total, a derivation by Thurrott (Thurrott, 2023).
- 4 years and 3 months is how long Windows 11 took to reach one billion users by Thurrott's count, about three months less than Windows 10's four and a half years (Thurrott, 2026).
- 2 times the Windows 10 rate: people accepted the Windows 11 upgrade offer at twice the rate seen for Windows 10 in the OS's first quarter, Microsoft said in January 2022 (Microsoft, 2022).
- 1.5 billion PCs is the worldwide population Microsoft 'routinely' cited from 2013 through 2018, Ed Bott recalled in 2025, the same round number Dell's COO used from memory in November 2025 (ZDNET, 2025).
| Statement and date | Count | Scope |
|---|---|---|
| Windows 10 monthly active devices, Microsoft, March 2020 | 1 billion | Devices running Windows 10 that Microsoft counts as monthly active (all form factors) · Worldwide · 2020-03 |
| Monthly active Windows devices, Microsoft, April 2021 (as recalled by ZDNET) | 1.3 billion | Devices running Windows 10 that Microsoft counts as monthly active · Worldwide · 2021-04 |
| Monthly active Windows devices, Microsoft (Panay), January 2022 | 1.4 billion | Devices running Windows that Microsoft counts as monthly active (no version split given) · Worldwide · 2022-01 |
| Monthly active devices on Windows 10 or 11, Microsoft annual report, fiscal 2022 | 1.4 billion | Devices running Windows 10 or Windows 11 that Microsoft counts as monthly active · Worldwide · 2022-06 |
| Windows 11 monthly active devices, Microsoft internal data via Windows Central, October 2023 | 400 million | Devices running Windows 11 that Microsoft counts as monthly active, per internal data seen by Windows Central · Worldwide · 2023-10 |
| Windows 10 monthly active devices, Microsoft internal data via Windows Central, November 2023 | 1 billion | Devices running Windows 10 that Microsoft counts as monthly active, per Windows Central's sources · Worldwide · 2023-11 |
| Monthly active Windows devices, Microsoft blog (corrected wording), June 2025 | 1.4 billion | Devices running Windows that Microsoft counts as monthly active · Worldwide · 2025-06 |
| Windows 11 users, Microsoft earnings call, January 2026 | 1 billion | Windows 11 users as Microsoft counts them (the call said 'users', not devices) · Worldwide · 2026-01 |
| Monthly active Windows devices, Microsoft earnings call, April 2026 | 1.6 billion | Devices running Windows that Microsoft counts as monthly active (no version split given) · Worldwide · 2026-04 |

Sources: StatCounter (2025, 2026); Valve; Lansweeper (2025, 2026); ControlUp (2024, 2025); Action1; Kaspersky; TeamViewer SE; Nexthink; Microsoft (2020-2026); TechRadar; ZDNet (2025); The Register; Windows Report; dpa-AFX; Windows Central (2023, 2025); Thurrott (2023, 2026)
Windows 11 vs Windows 10 market share by month
Windows 11 first overtook Windows 10 in worldwide desktop web traffic in July 2025, at 53.5% against 42.9% (StatCounter, 2025).

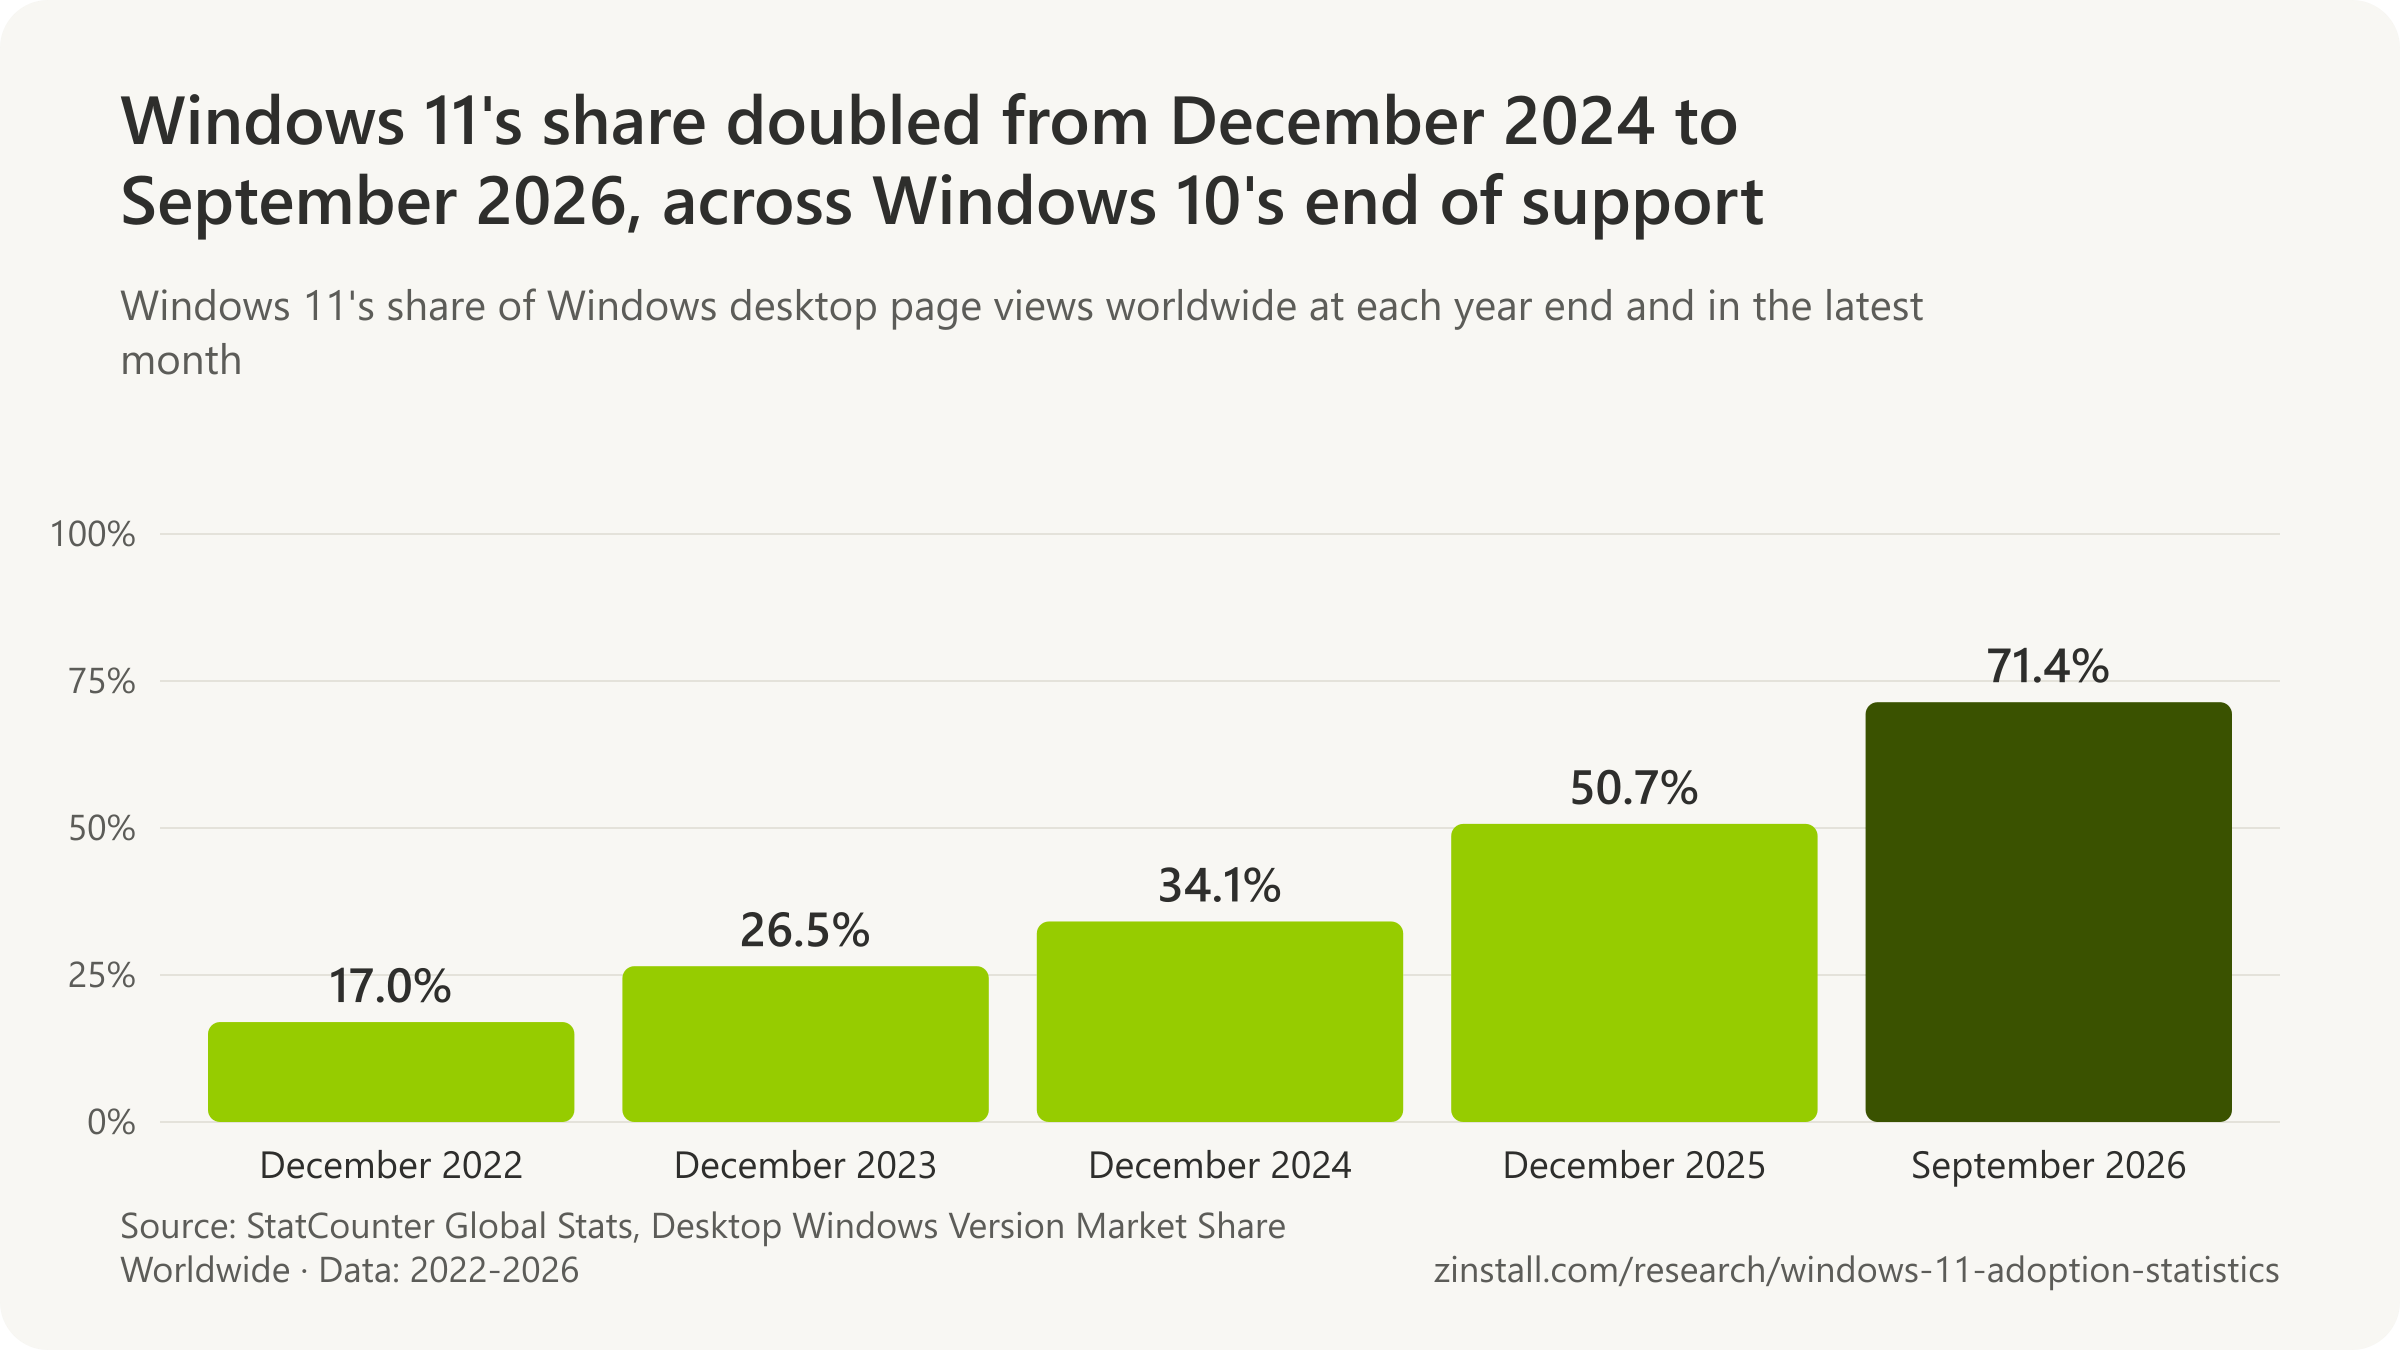
- Windows 11's share rose 18.6 points in the twelve months to September 2026.
- Windows 10 lost 13.9 points of share in the eleven months after its support ended, from 41.7% to 27.8%.
- On Steam, Windows 11 first passed 70% in December 2025, at 70.8% of participants.
- Windows 11 needed 45 months from its October 2021 launch to lead Windows 10 in desktop web traffic.
| Country or region | Crossover month |
|---|---|
| United Kingdom | January 2025 |
| North America | March 2025 |
| Japan | April 2025 |
| Europe | September 2025 |
| Germany | October 2025 |
| France | October 2025 |
| China | October 2025 |
| Africa | October 2025 |
| India | January 2026 |
| Russia (fell back under Windows 10 from June 2026) | May 2026 |
Sources: StatCounter Global Stats (2026); StatCounter (2026a, 2026b); Valve
More statistics (119)
Windows 11 first exceeded Windows 10 in Windows desktop page views worldwide in July 2025, at 53.5% against 42.9% (StatCounter, 2025).
Windows 11 overtook Windows 10 on the two consumer trackers at different times, and both series carry jumps that reflect the tracker's sample as much as the market. The charts show every month of each series; the notes below mark the months that need care, and the business audits follow.

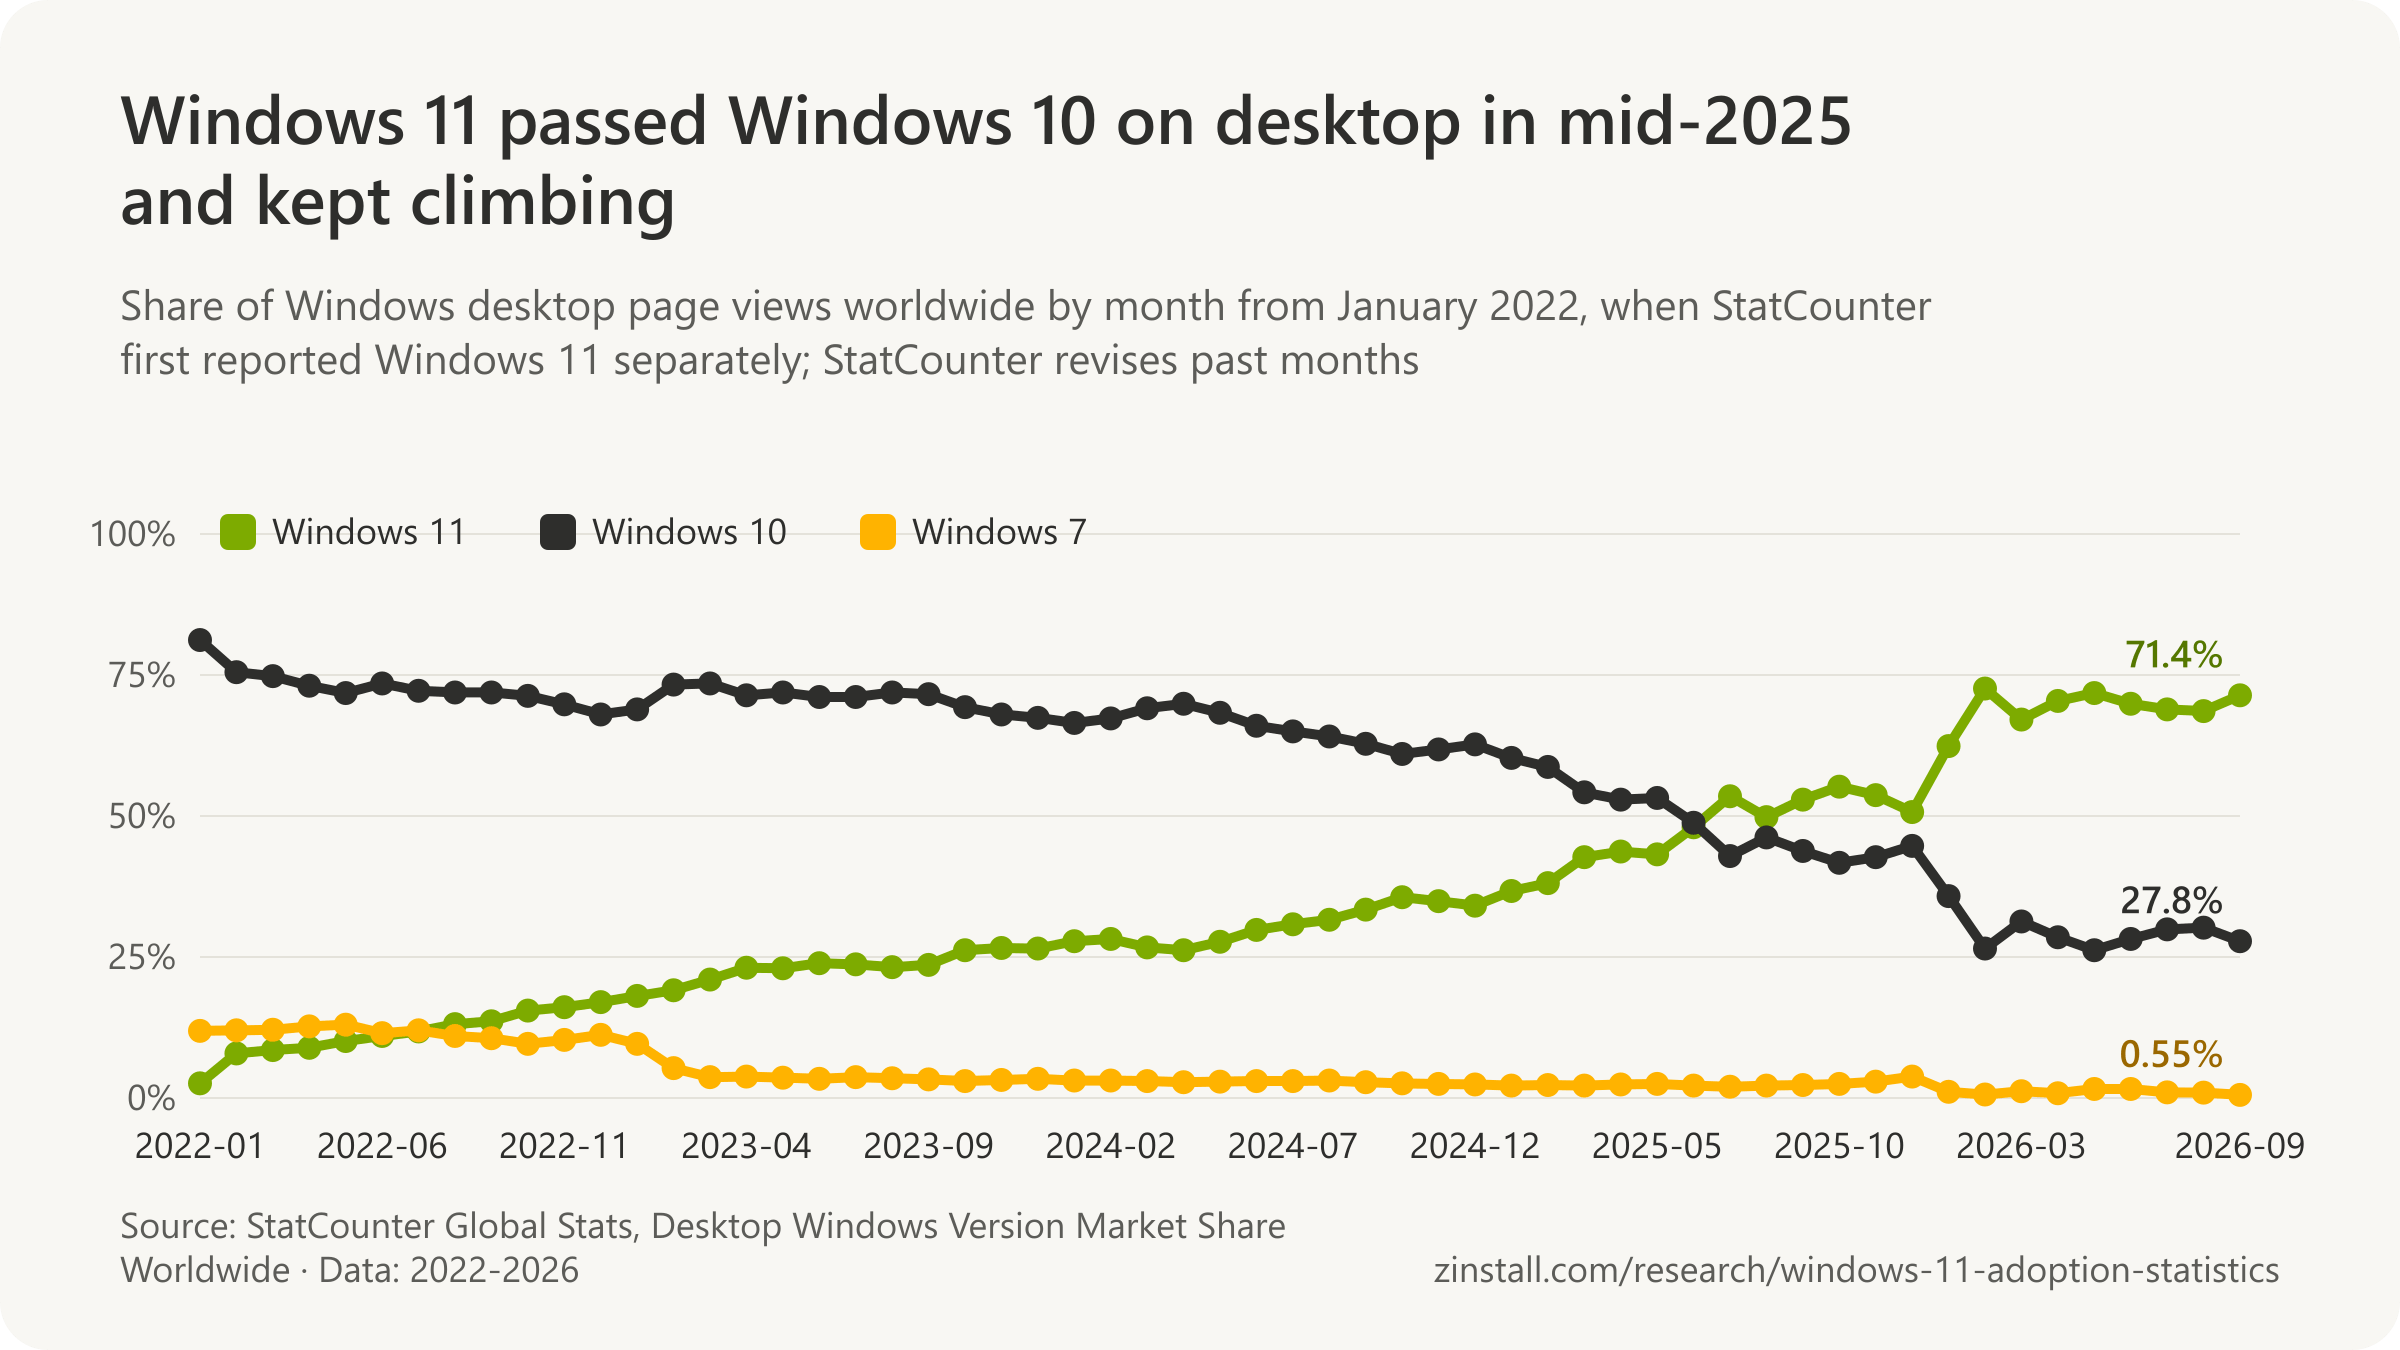
- Windows 11's share of Windows desktop page views worldwide rose 18.6 points in twelve months, from 52.9% in September 2025 to 71.5% in September 2026 (StatCounter monthly series, 2026).
- 45 months passed between Windows 11's launch in October 2021 and July 2025, the first month it led Windows 10 in StatCounter's worldwide desktop data (StatCounter, 2026).
- 48.0% of Windows desktop page views worldwide came from Windows 11 in June 2025, 0.8 points behind Windows 10 (StatCounter, 2026).
- 53.5% of Windows desktop page views worldwide came from Windows 11 in July 2025, the first month it exceeded Windows 10 (42.9%) on StatCounter (StatCounter, 2026).
- 41.7% of Windows desktop page views worldwide came from Windows 10 in October 2025, the month its support ended on 14 October (StatCounter, 2026).
- Windows 10's share of Windows desktop page views worldwide fell 13.9 points in the eleven months after its end of support, from 41.7% in October 2025 to 27.8% in September 2026 (StatCounter monthly series, 2026).
- Windows 11's share of Windows desktop page views worldwide rose 16.6 points during 2025, from 34.1% in December 2024 to 50.7% in December 2025 (StatCounter monthly series, 2026).
- Windows 11's share of Windows desktop page views worldwide rose 11.7 points between December 2025 and January 2026, from 50.7% to 62.4% (StatCounter monthly series, 2026).
- Windows 11's share of Windows desktop page views worldwide rose 10.2 points between January and February 2026, from 62.4% to 72.6%, the second ten-point jump in two months (StatCounter monthly series, 2026).
- 67.1% of Windows desktop page views worldwide came from Windows 11 in March 2026, 5.4 points below the February peak (StatCounter, 2026).
- 81.4% of Windows desktop page views worldwide came from Windows 10 in October 2021, the month Windows 11 launched (StatCounter, 2026).
- 0% is StatCounter's recorded Windows 11 share of Windows desktop page views for October to December 2021 because it did not report Windows 11 as a separate version until January 2022, when it first appeared at 2.6% (StatCounter, 2026).
- 2.6% of Windows desktop page views worldwide came from Windows 11 in January 2022, the first month StatCounter reported it separately (StatCounter, 2026).
- Windows 11's share of Windows desktop page views worldwide rose 5.5 points between June and July 2025, from 48.0% to 53.5%, the month it overtook Windows 10 (StatCounter monthly series, 2026).
- 49.8% of Windows desktop page views worldwide came from Windows 11 in August 2025, 3.7 points below July and the month Windows 10 (46.2%) came closest to regaining the lead (StatCounter, 2026).
- 55.2% of Windows desktop page views worldwide came from Windows 11 in October 2025, the month Windows 10 support ended (StatCounter, 2026).
- Windows 10's share of Windows desktop page views worldwide fell 16.0 points in twelve months, from 43.8% in September 2025 to 27.8% in September 2026 (StatCounter monthly series, 2026).
- 62.4% of Windows desktop page views worldwide came from Windows 11 in January 2026, up 11.7 points from December 2025 (StatCounter, 2026).
- 72.6% of Windows desktop page views worldwide came from Windows 11 in February 2026, up 10.2 points in one month (StatCounter, 2026).
- 26.5% of Windows desktop page views worldwide came from Windows 10 in February 2026, down 9.3 points in one month (StatCounter, 2026).
- 69.9% of Windows desktop page views worldwide came from Windows 11 in June 2026, down from 71.8% in May (StatCounter, 2026).
| Month | Windows 11 share | Scope |
|---|---|---|
| December 2022 | 17.0% | Windows desktop devices (desktops and laptops) in StatCounter's page-view sample · Worldwide · 2022-12 |
| December 2023 | 26.5% | Windows desktop devices (desktops and laptops) in StatCounter's page-view sample · Worldwide · 2023-12 |
| December 2024 | 34.1% | Windows desktop devices (desktops and laptops) in StatCounter's page-view sample · Worldwide · 2024-12 |
| December 2025 | 50.7% | Windows desktop devices (desktops and laptops) in StatCounter's page-view sample · Worldwide · 2025-12 |
| September 2026 (latest) | 71.4% | Windows desktop devices (desktops and laptops) in StatCounter's page-view sample · Worldwide · 2026-09 |
| Month | Windows 10 share | Scope |
|---|---|---|
| December 2021 | 82.5% | Windows desktop devices (desktops and laptops) in StatCounter's page-view sample · Worldwide · 2021-12 |
| December 2022 | 68.0% | Windows desktop devices (desktops and laptops) in StatCounter's page-view sample · Worldwide · 2022-12 |
| December 2023 | 67.4% | Windows desktop devices (desktops and laptops) in StatCounter's page-view sample · Worldwide · 2023-12 |
| December 2024 | 62.7% | Windows desktop devices (desktops and laptops) in StatCounter's page-view sample · Worldwide · 2024-12 |
| December 2025 | 44.7% | Windows desktop devices (desktops and laptops) in StatCounter's page-view sample · Worldwide · 2025-12 |
| September 2026 (latest) | 27.8% | Windows desktop devices (desktops and laptops) in StatCounter's page-view sample · Worldwide · 2026-09 |
Gamers first: the Steam series

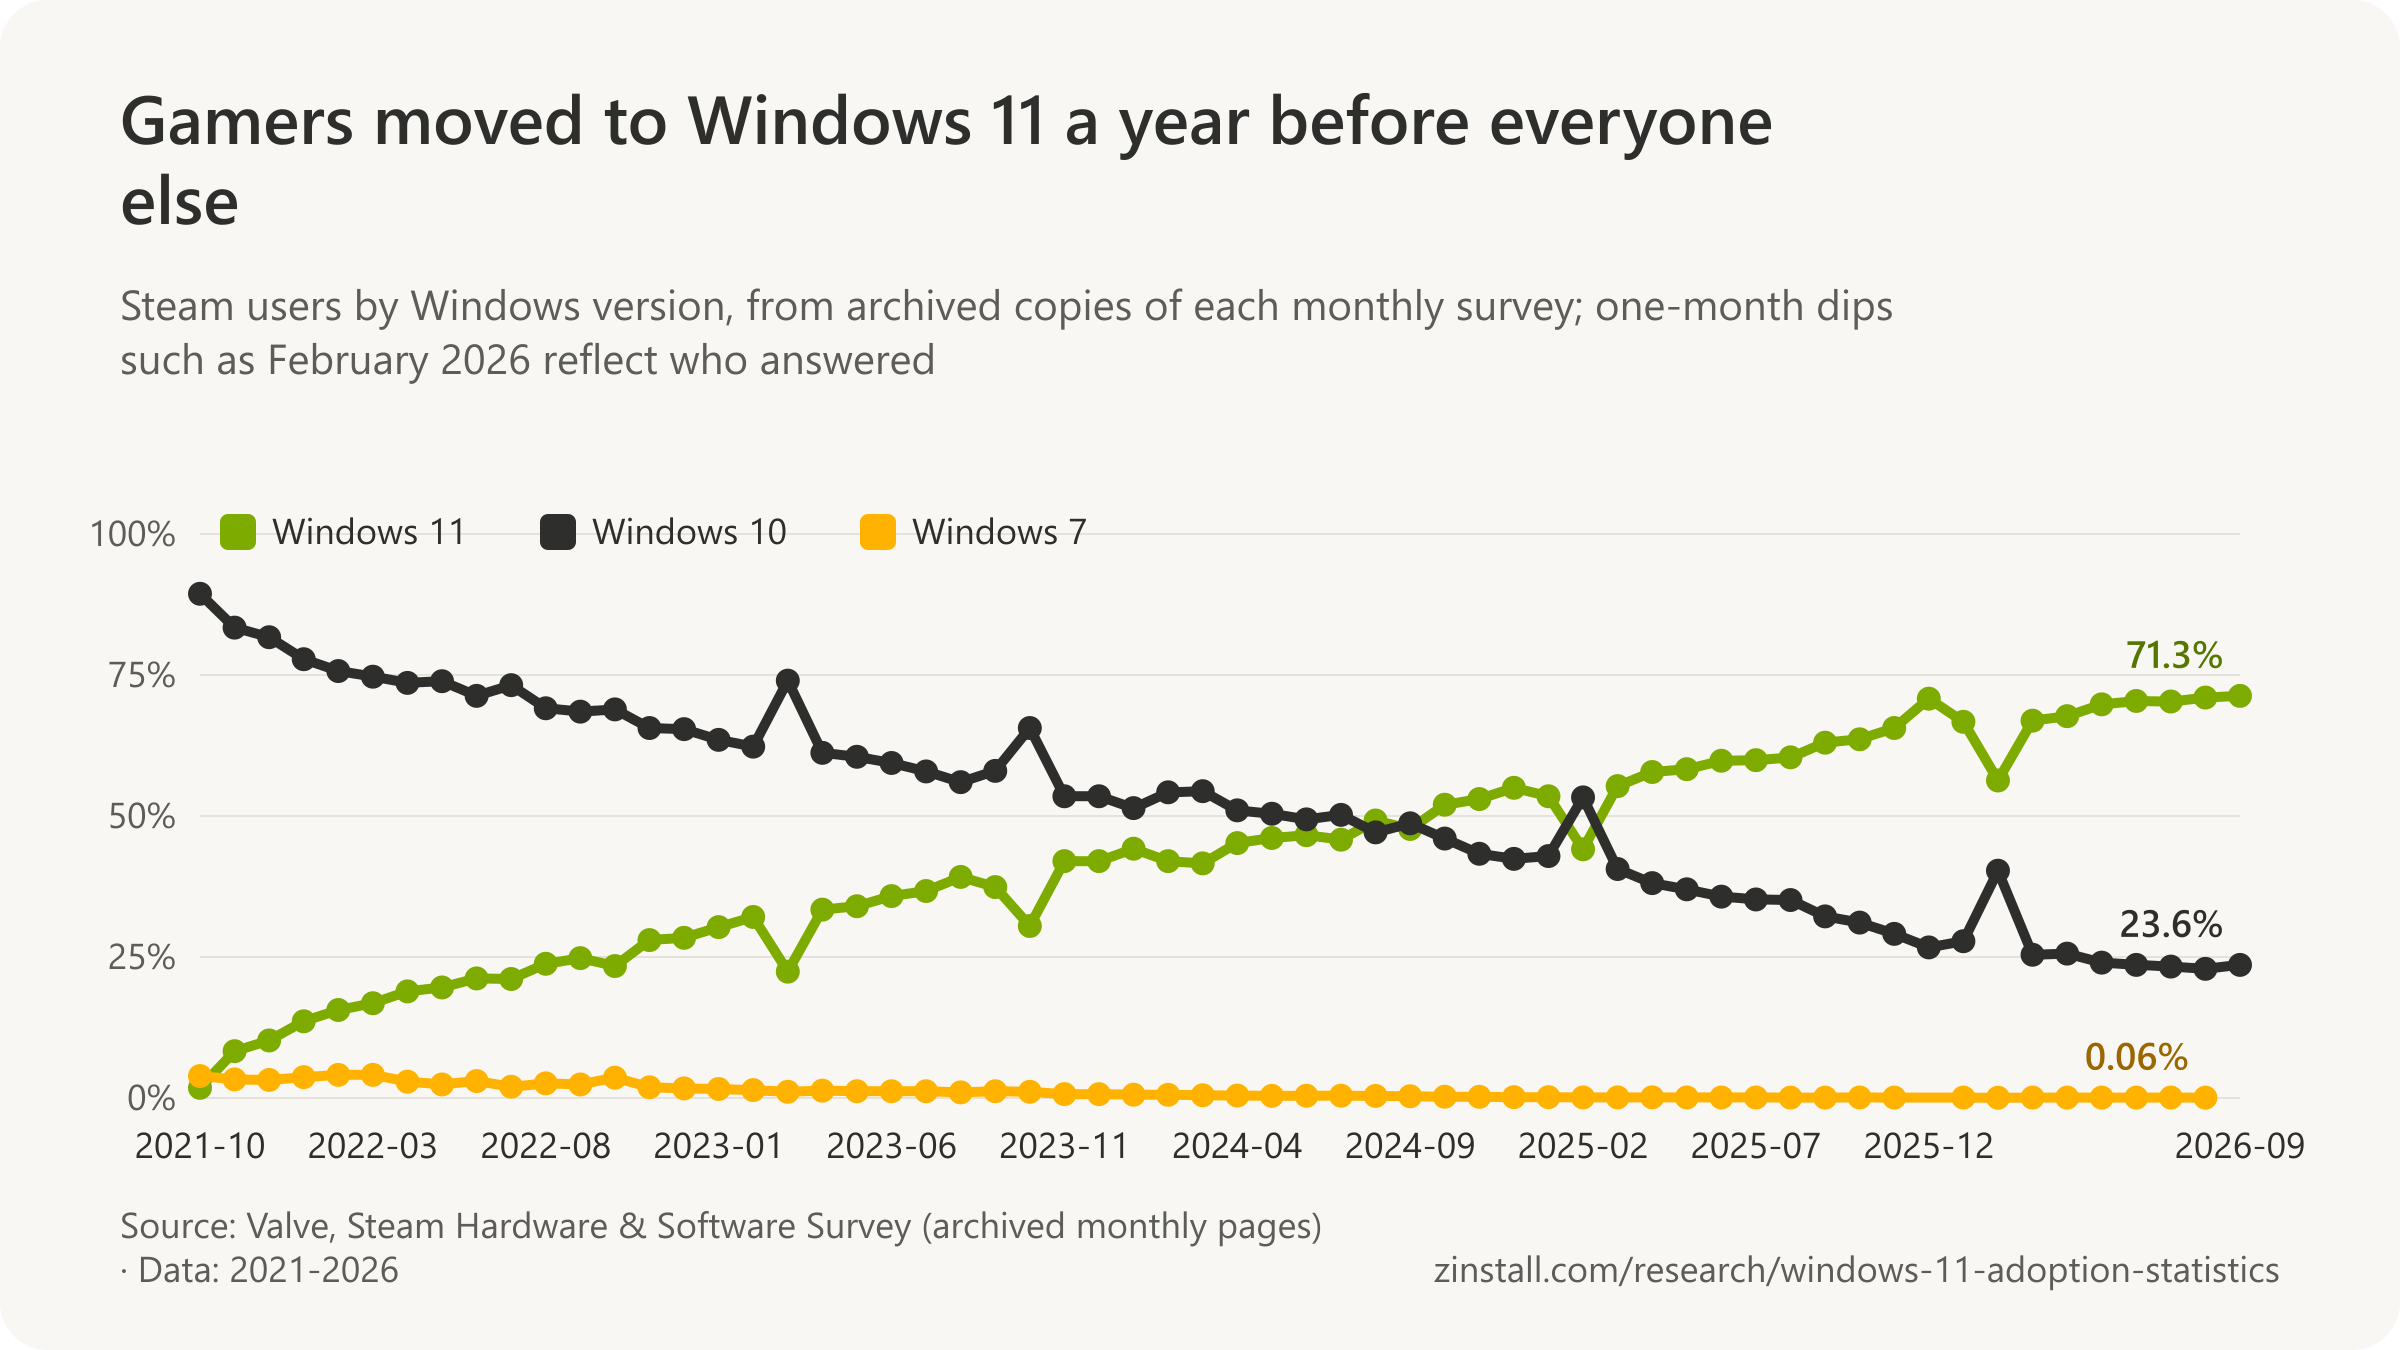
- 49.2% of Steam survey participants ran Windows 11 in August 2024, overtaking Windows 10 (47.1%) for the first time in the Steam survey (Valve Steam Hardware and Software Survey, 2024).
- 63.0% of Steam survey participants ran Windows 11 in September 2025, a year before the 71.3% of September 2026 (Valve Steam Hardware and Software Survey, 2025).
- 22.4% of Steam survey participants ran Windows 11 in March 2023, a one-month drop of 9.7 points that reversed the next month (33.4% in April 2023), a participant-mix swing rather than migration (Valve Steam Hardware and Software Survey, 2023).
- 30.5% of Steam survey participants ran Windows 11 in October 2023, down 6.9 points in a month and back to 42.0% in November 2023, the second participant-mix swing in the series (Valve Steam Hardware and Software Survey, 2023).
- 44.1% of Steam survey participants ran Windows 11 in February 2025, down 9.4 points from January with Windows 10 up 10.5 points to 53.3%, before March 2025 restored Windows 11 to 55.3% (Valve Steam Hardware and Software Survey, 2025).
- 48.7% of Steam survey participants ran Windows 10 in September 2024 against 47.7% on Windows 11, briefly reversing August's crossover before Windows 11 pulled ahead for good in October 2024 (Valve Steam Hardware and Software Survey, 2024).
- 52.0% of Steam survey participants ran Windows 11 in October 2024, the first month it passed half of participants, against 46.0% on Windows 10 (Valve Steam Hardware and Software Survey, 2024).
- 60.4% of Steam survey participants ran Windows 11 in August 2025, the first month above 60%, against 35.1% on Windows 10 (Valve Steam Hardware and Software Survey, 2025).
- 70.8% of Steam survey participants ran Windows 11 in December 2025, the first month above 70%, against 26.7% on Windows 10 (Valve Steam Hardware and Software Survey, 2025).
- 56.3% of Steam survey participants ran Windows 11 in February 2026, down 10.4 points in one month, while Windows 10 jumped 12.5 points to 40.3%, a change in who answered the survey rather than a migration back (Valve Steam Hardware and Software Survey, 2026).
- 40.3% of Steam survey participants ran Windows 10 in February 2026, up 12.5 points in one month, before falling back to 25.4% in March 2026 (Valve Steam Hardware and Software Survey, 2026).
- 66.9% of Steam survey participants ran Windows 11 in March 2026, up 10.6 points as the February sample swing reversed, with Windows 10 down 14.9 points to 25.4% (Valve Steam Hardware and Software Survey, 2026).
- Gigazine reported the Steam survey swing to 56.3% Windows 11 and 40.3% Windows 10 (down 10.4 and up 12.5 points) and, citing Reddit, attributed it to a change in who answered the survey, with Simplified Chinese respondents up '30.74%', a figure Gigazine does not define as points or percent (Gigazine, 2026).
- The Register reported the February 2025 Steam survey as Windows 11 'going backwards' at 44.1% of users (down 9.4 points) with Windows 10 up 10.5 points to 53.3% (The Register, 2025).
- Windows Central reported the June 2026 Steam survey as Windows 11 passing 70% 'for the first time' at 70.4% of Steam users (up 0.7 points), although its own report on December 2025 had given 70.8%, with Windows 10 down 0.4 points, Linux down 0.3 points to 3.7% and macOS up to 2.2% (Windows Central, 2026).
| Month | Windows 11 share | Scope |
|---|---|---|
| October 2021 (launch month) | 1.8% | Steam users who took part in Valve's voluntary monthly hardware and software survey · Worldwide · 2021-10 |
| December 2022 | 28.4% | Steam users who took part in Valve's voluntary monthly hardware and software survey · Worldwide · 2022-12 |
| December 2023 | 42.0% | Steam users who took part in Valve's voluntary monthly hardware and software survey · Worldwide · 2023-12 |
| December 2024 | 55.0% | Steam users who took part in Valve's voluntary monthly hardware and software survey · Worldwide · 2024-12 |
| December 2025 | 70.8% | Steam users who took part in Valve's voluntary monthly hardware and software survey · Worldwide · 2025-12 |
| September 2026 (latest) | 71.3% | Steam users who took part in Valve's voluntary monthly hardware and software survey · Worldwide · 2026-09 |
Business fleets: the audits
| Audit | Windows 11 share | Scope |
|---|---|---|
| January 2022 (via Silicon UK) | 0.5% | PCs scanned by Lansweeper (more than 10 million Microsoft devices in the April update) · Worldwide · 2022-01 |
| April 2022 (10 million machines, via The Register) | 1.4% | 10 million PCs scanned by Lansweeper, 20% enterprise and 80% consumer (via its Fing app) · Worldwide · 2022-04 |
| October 2022 (via Borncity) | 2.6% | Windows devices scanned by Lansweeper customers · Worldwide · 2022-10 |
| October 2023 (about 33 million devices) | 8.4% | Windows devices scanned by Lansweeper customers (estimated 33 million) · Worldwide · 2023-10 |
| October 2024 (15 million devices, via The Register) | 23.1% | 15 million Windows devices monitored by Lansweeper · Worldwide · 2024-10 |
| September 2025 (over 8 million devices) | 60.1% | over 8 million Windows devices scanned by Lansweeper customers · Worldwide · 2025-09 |
| July 2026 | 78.8% | Windows devices in Lansweeper's HVMND Collective Intelligence data (a subset of millions of assets across tens of thousands of customer sites) · Worldwide · 2026-07 |

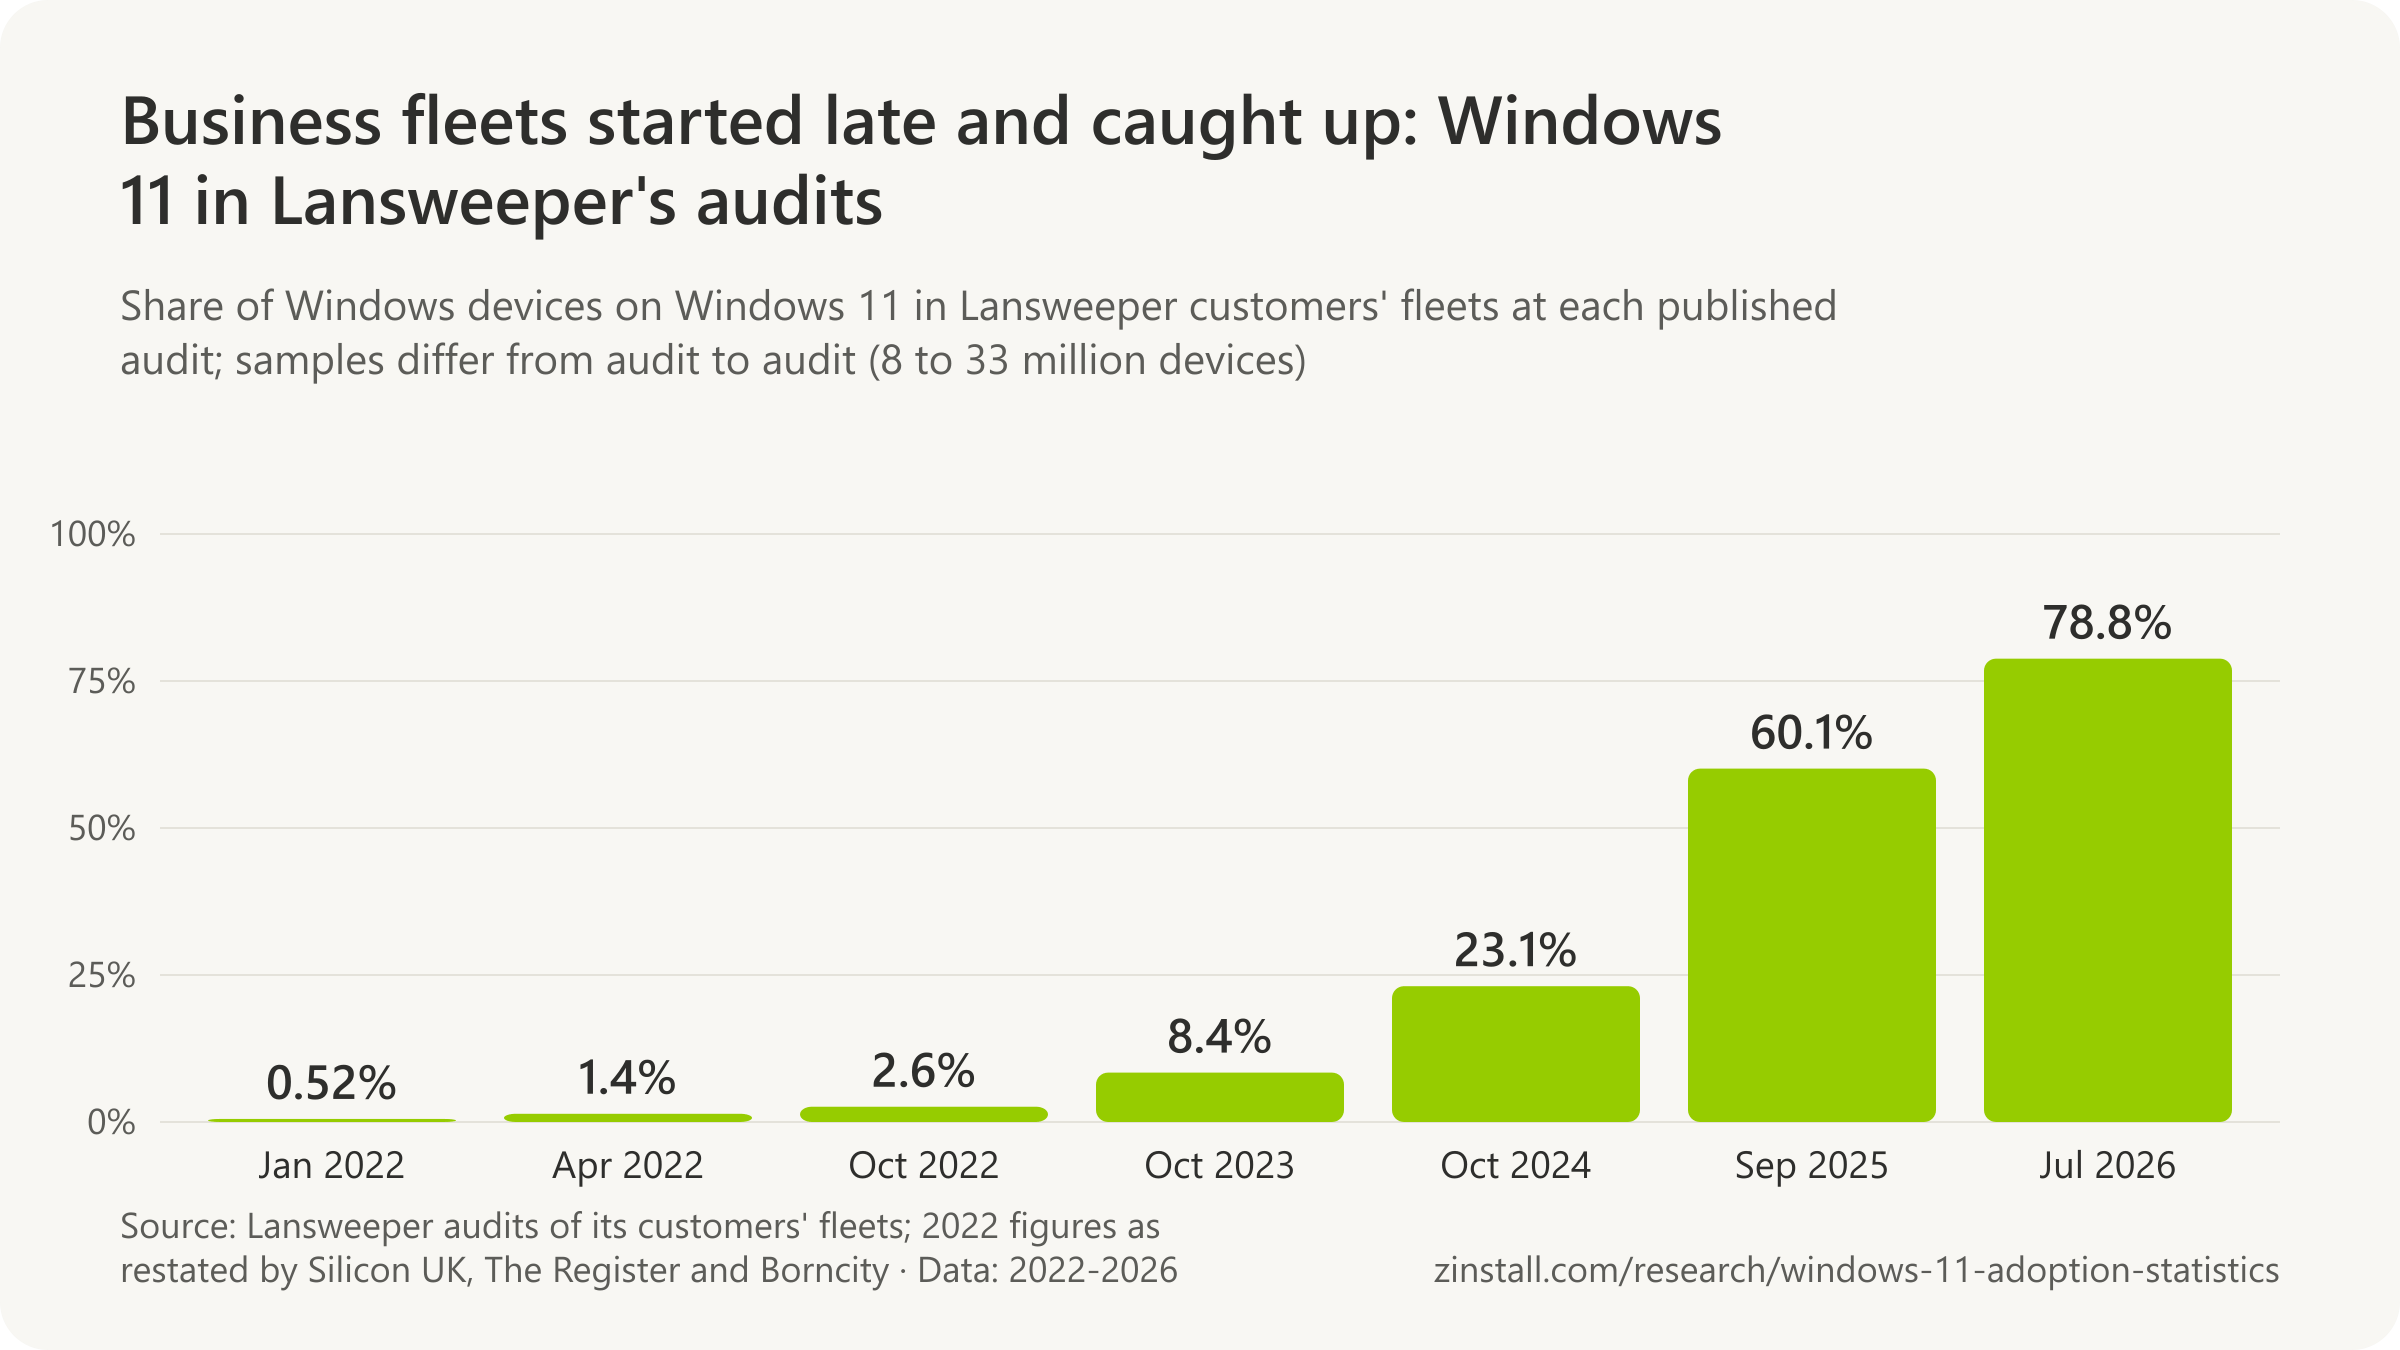
- 18% of the more than 750,000 enterprise Windows endpoints in ControlUp's August 2024 sample were running Windows 11 (ControlUp, 2024).
- 39% of the enterprise Windows endpoints in ControlUp's sample were running Windows 11 by March 2025, up from 18% when tracking began in August 2024 (ControlUp, 2025).
- 50% of the more than one million enterprise Windows endpoints managed in ControlUp's sample had yet to complete their migration to Windows 11 in June 2025, four months before Windows 10 end of support (ControlUp, 2025).
- 21% of business machines in ControlUp's sample had yet to migrate to Windows 11 in late October 2025, per ControlUp's own summary of an IT Brew feature (ControlUp, 2025).
- 46% of Windows endpoints managed through Action1 ran Windows 11 in October 2024, a year before Windows 10 end of support (Action1, 2025).
- Windows 10's share of Windows devices in Lansweeper's customer fleets fell from roughly 50% in mid-2025 to the low-to-mid 40s at the October 2025 end of support, by its own description (its September 2025 audit had 39.9%), and to about 18.6% by June 2026 (Lansweeper, 2026).
- Windows 10 devices among Nexthink's customer endpoints fell 33% between 19 May and 1 August 2025 (Nexthink, 2025).
- Windows 11's share of Lansweeper-scanned business devices rose 9.5 points between July and September 2025 and 26.3 points since the start of 2025 (Lansweeper, 2025).
- PC-WELT restated Lansweeper's 2026 figures as 16.9% of business and organisation devices on Windows 10 and 78.8% on Windows 11, and gave Lansweeper's mid-2025 Windows 10 share as 47.9% (PC-WELT, 2026).
- 80% of business devices in Lansweeper's spring 2023 data still ran Windows 10, and 5.5% of compatible business devices ran Windows 11, up from 2.6% about six months earlier (TechRadar, 2023).
- 82% of the more than 750,000 enterprise Windows endpoints in ControlUp's August 2024 sample had not yet migrated to Windows 11, and 18% were running it (ControlUp, 2024).
- TechRadar restated ControlUp's June 2025 report as half of business-managed Windows devices not yet switched to Windows 11, with over 80% still on Windows 10 a year earlier (TechRadar, 2025).
As first published, and as revised
- 49.1% of Windows desktop page views worldwide came from Windows 11 in September 2025 as StatCounter first published the month on 1 October 2025, before revision (StatCounter, 2025).
- 52.9% of Windows desktop page views worldwide came from Windows 11 in September 2025, one month before Windows 10's end of support (StatCounter, 2026).
- 9.2% of Windows desktop page views worldwide were attributed to Windows 7 in September 2025 as first published on 1 October 2025, a figure StatCounter later revised to 2.3% (StatCounter, 2025).
- 2.3% of Windows desktop page views worldwide came from Windows 7 in September 2025 after StatCounter's revision (StatCounter, 2026).
- 72.8% of Windows desktop page views worldwide came from Windows 11 in February 2026 as StatCounter first published the month on 1 March 2026, later revised to 72.6% (StatCounter, 2026).
- 72.6% of Windows desktop page views worldwide came from Windows 11 in February 2026, up 10.2 points in one month (StatCounter, 2026).
- 56.6% of desktop page views worldwide were attributed to Windows in June 2026 as StatCounter's page showed on 9 July 2026, before the company corrected the figure (StatCounter, 2026).
- 72.0% of desktop page views worldwide came from Windows in June 2026 after StatCounter corrected a reporting error that had first shown 56.6% (StatCounter, 2026).
- 40.8% of Windows desktop page views worldwide came from Windows 10 in September 2025 as first published on 1 October 2025, before revision (StatCounter, 2025).
- 43.8% of Windows desktop page views worldwide came from Windows 10 in September 2025 (StatCounter, 2026).
- 9.6% of Windows desktop page views worldwide were attributed to Windows 7 in September 2025 in StatCounter's data as reported by Windows Latest, which called the spike a detection error (Windows Latest, 2025).
- 9.6% of worldwide desktop Windows page views were attributed to Windows 7 in September 2025 in StatCounter's first-published data as reported by TweakTown (TweakTown, 2025).
- 49.1% of Windows desktop page views worldwide came from Windows 11 at the end of September 2025 per StatCounter as reported by Borncity (Borncity, 2025).
- 2.5% of desktop Windows page views worldwide came from Windows 7 in October 2025 after StatCounter corrected a bug that had overstated Windows 7's share, as reported by Guru3D (Guru3D, 2025).
- 53.4% of Windows desktop page views worldwide came from Windows 11 in July 2025 as StatCounter first published the month on 1 August 2025 (StatCounter, 2025).
- 43.0% of Windows desktop page views worldwide came from Windows 10 in July 2025 as first published on 1 August 2025 (StatCounter, 2025).
- 52% of desktop Windows page views came from Windows 11 in StatCounter's running July 2025 data on 7 July 2025, the day the crossover was first reported (Notebookcheck, 2025).
- 44.6% of desktop Windows page views came from Windows 10 in StatCounter's running July 2025 data on 8 July 2025 as reported by Gigazine (Gigazine, 2025).
- 53.5% of Windows devices measured by StatCounter ran Windows 11 in July 2025 as restated by PCMag (via Yahoo Tech) in September 2025 (PCMag, 2025).
- 49.1% of Windows devices measured by StatCounter ran Windows 11 in August 2025, down from 53.5% in July, as reported by PCMag (PCMag, 2025).
- 41.7% of Windows desktop page views worldwide came from Windows 10 in October 2025 as StatCounter first published the month on 2 November 2025 (StatCounter, 2025).
- 2.5% of Windows desktop page views worldwide came from Windows 7 in October 2025 as first published on 2 November 2025, after StatCounter had corrected the September spike (StatCounter, 2025).
- 55.2% of desktop PCs worldwide ran Windows 11 in October 2025 per StatCounter as reported by Guru3D, with Windows 10 at 41.7% (Guru3D, 2025).
- 62.2% of Windows desktop page views worldwide came from Windows 11 in January 2026 as StatCounter first published the month on 1 February 2026 (StatCounter, 2026).
- 26.3% of Windows desktop page views worldwide came from Windows 10 in February 2026 as first published on 1 March 2026, later revised to 26.5% (StatCounter, 2026).
- 72.6% of Windows desktop page views worldwide came from Windows 11 in February 2026, up from 62.4% in January, as Neowin reported from StatCounter on 1 March 2026 (Neowin, 2026).
- 72.8% of Windows desktop page views worldwide came from Windows 11 in February 2026 as Windows Report read StatCounter's page on the morning of 1 March 2026 (Windows Report, 2026).
- Windows 11's worldwide market share rose 10.16 percentage points in February 2026, from 62.41% to 72.57%, as PCWorld reported from StatCounter (PCWorld, 2026).
- 69.9% of Windows desktop page views worldwide came from Windows 11 in June 2026 as shown on StatCounter's page on 9 July 2026 (StatCounter, 2026).
- 21.5% of desktop page views worldwide were classed as 'Unknown' operating system in StatCounter's first-published June 2026 data, the row that absorbed the missing Windows share (StatCounter, 2026).
- 56.6% of the desktop market was the Windows share StatCounter first reported for June 2026, down from about 79% in April, a drop Windows Latest showed to be a reporting error (Windows Latest, 2026).
- 72% of the desktop market is the Windows share StatCounter showed for June 2026 after it corrected its data, according to Windows Latest (Windows Latest, 2026).
- 56.6% of global desktop OS page views came from Windows in June 2026 according to StatCounter's first-published data as reported by Linuxiac, which read it as Windows falling below 60% (Linuxiac, 2026).
- 78.9% of desktop page views worldwide came from Windows in April 2026, the baseline against which the June 2026 reporting error was measured (StatCounter, 2026).
- 63.0% of desktop page views worldwide were attributed to Windows in August 2026, with macOS at 15.1% and Linux at 8.8%, a pattern like the corrected June 2026 error and still inside StatCounter's revision window on 12 October 2026 (StatCounter, 2026).
Sources: StatCounter Global Stats; StatCounter (2026); Valve; Gigazine (2025, 2026); The Register (2022, 2024, 2025); Windows Central; Silicon UK; Borncity (2022, 2025); Lansweeper (2023, 2025, 2026); ControlUp (2024, 2025); Action1; Nexthink; PC-WELT; TechRadar (2023, 2025); AdDuplex (2022); Windows Latest (2025, 2026); TweakTown; Guru3D; Notebookcheck; PCMag; Neowin; Windows Report; PCWorld; Linuxiac
Windows 11 market share by country

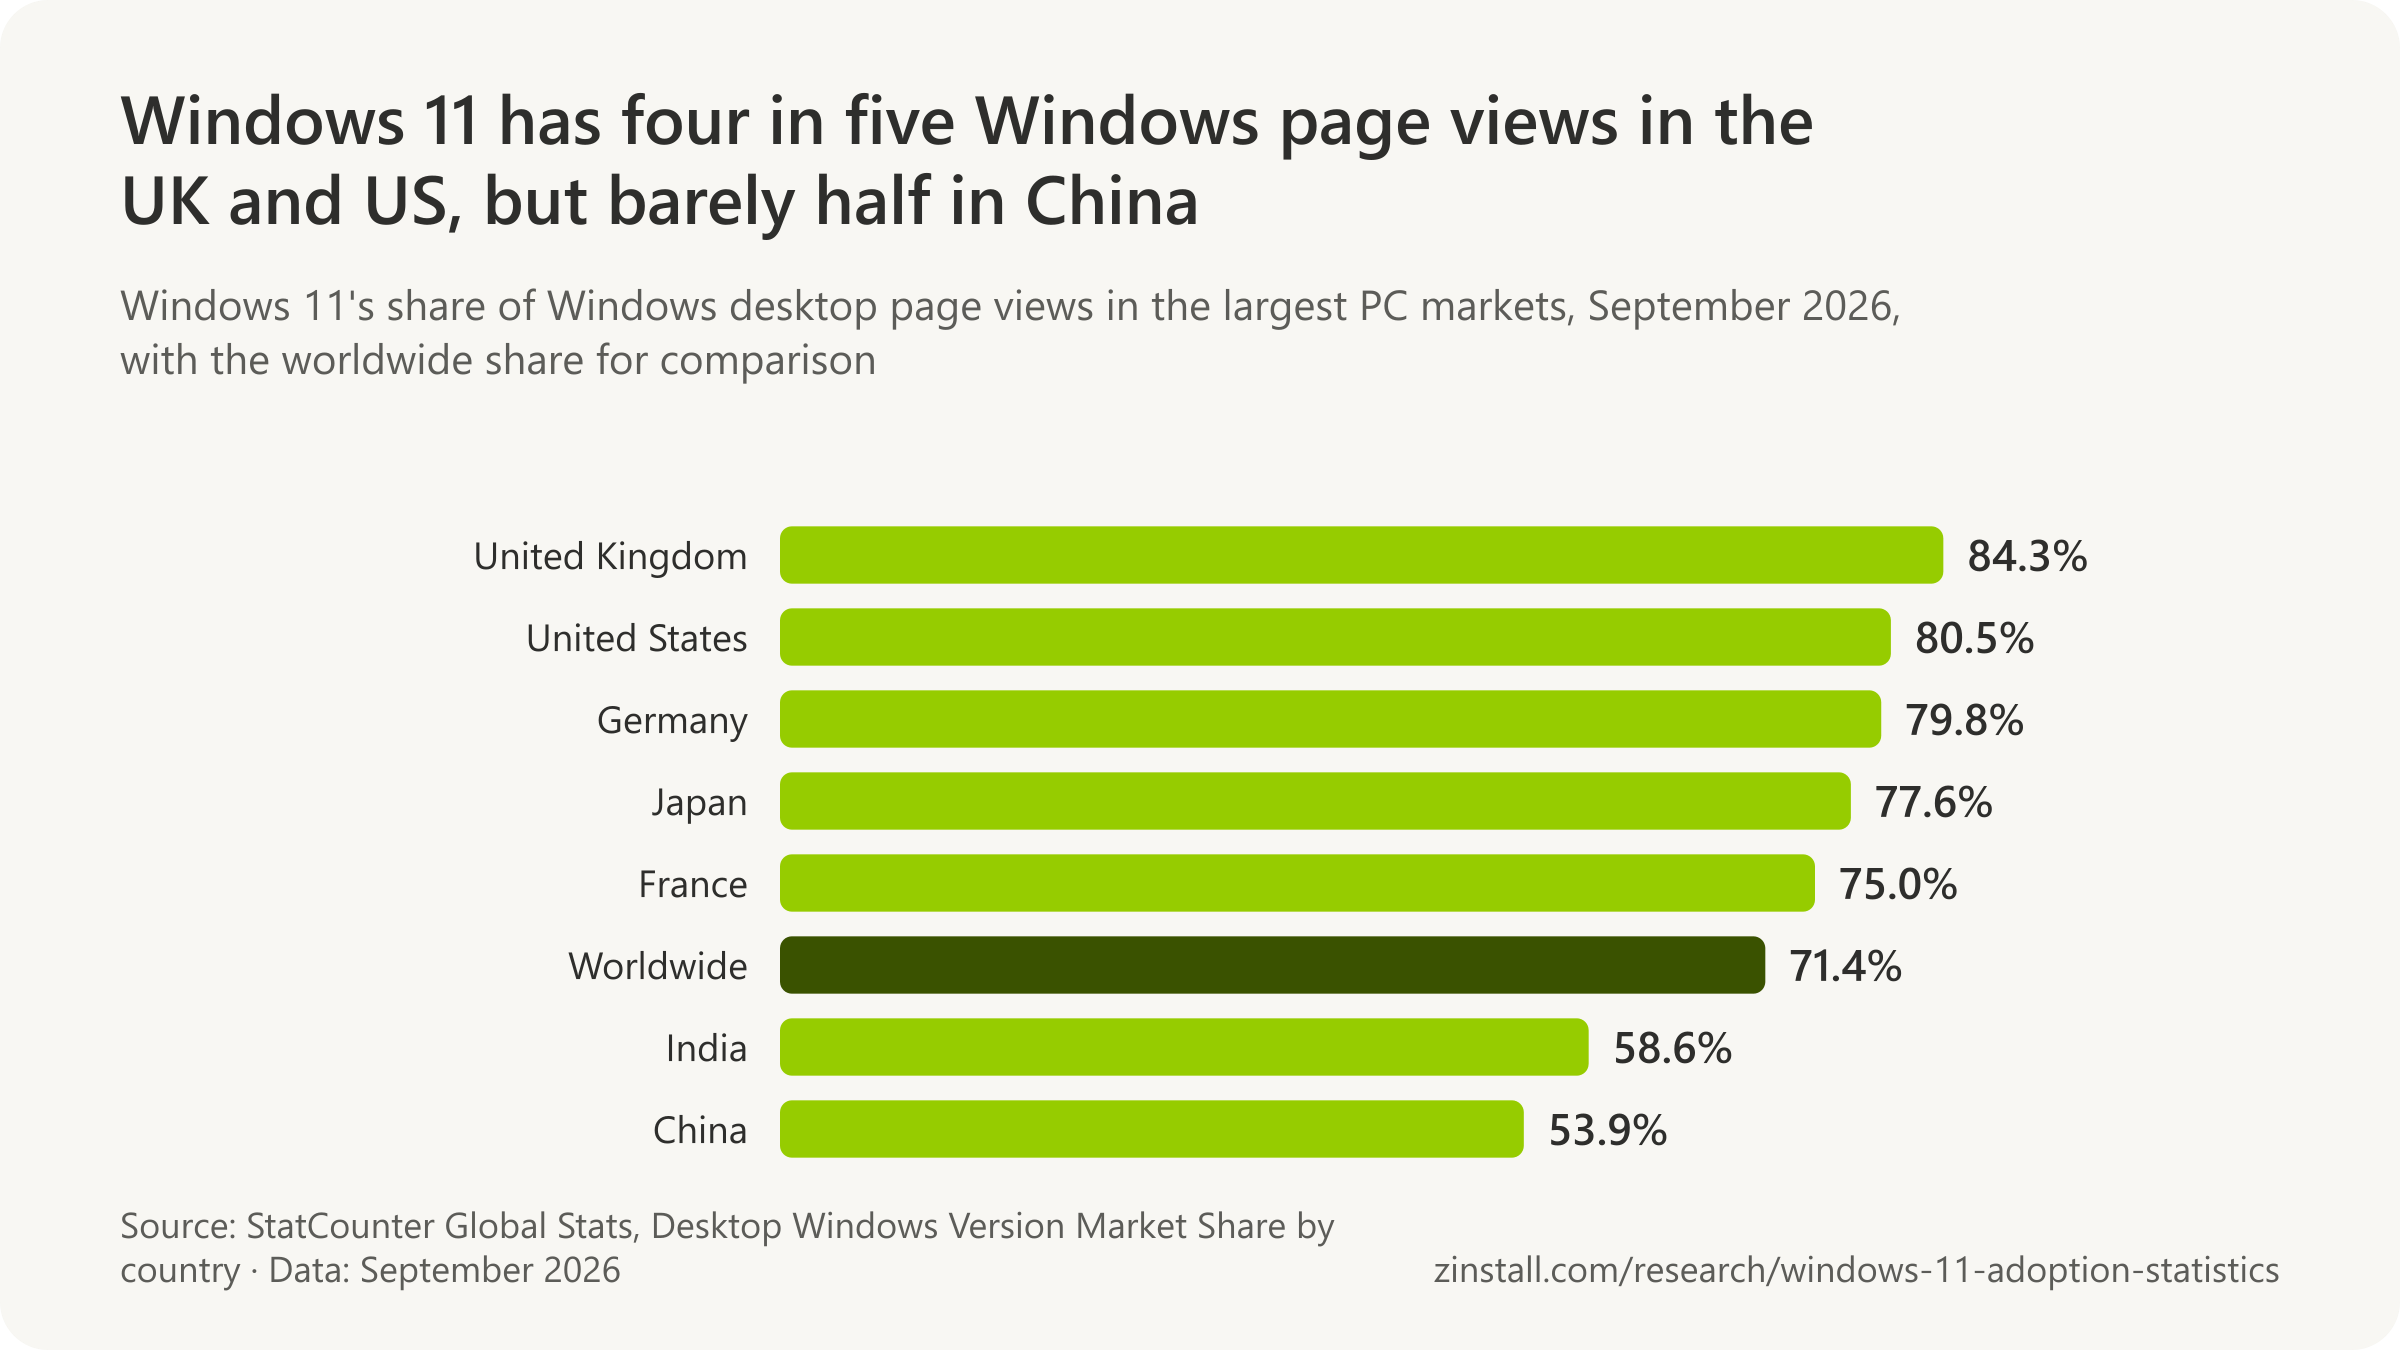
- Germany moved fastest in the year to September 2026: Windows 11's share rose 35.7 points, from 44.1%.
- In the United States, 80.5% of Windows desktop web traffic came from Windows 11 in September 2026.
- About 21 million people in the UK still used a Windows 10 computer in September 2025.
| Region | Windows 11 share |
|---|---|
| Oceania | 80.2% |
| North America | 79.9% |
| Europe | 74.5% |
| South America | 73.0% |
| Africa | 70.3% |
| Asia | 62.4% |
Sources: StatCounter Global Stats (2026); ESET Deutschland GmbH; Which?; StatCounter
More statistics (151)
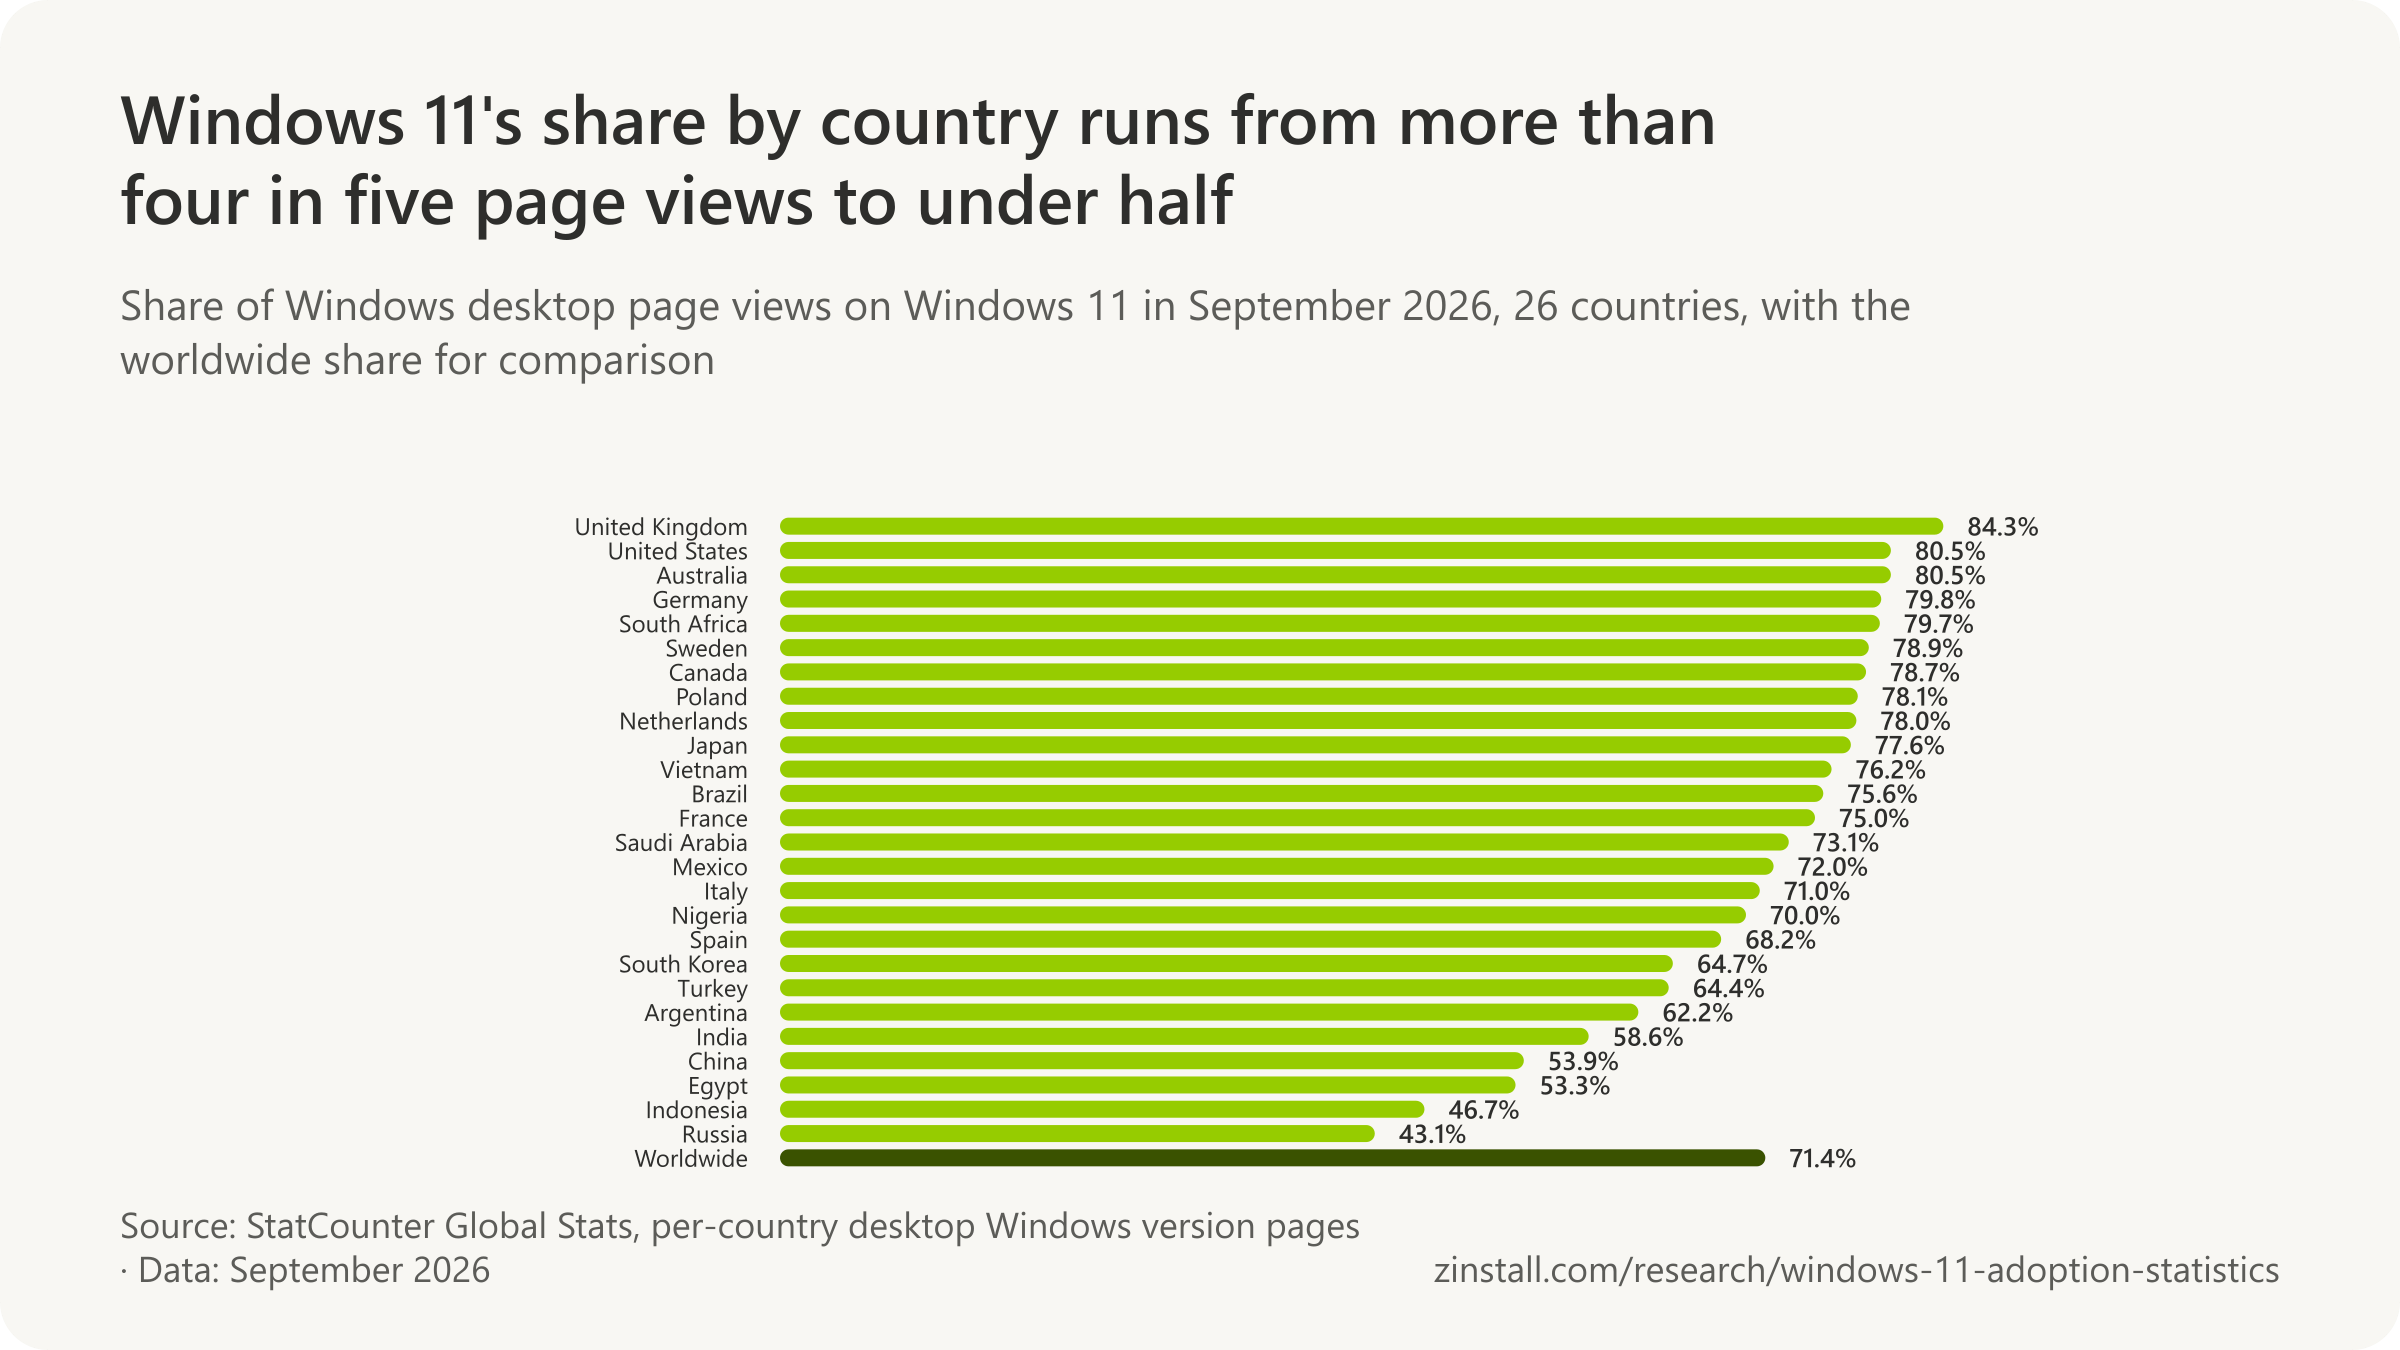
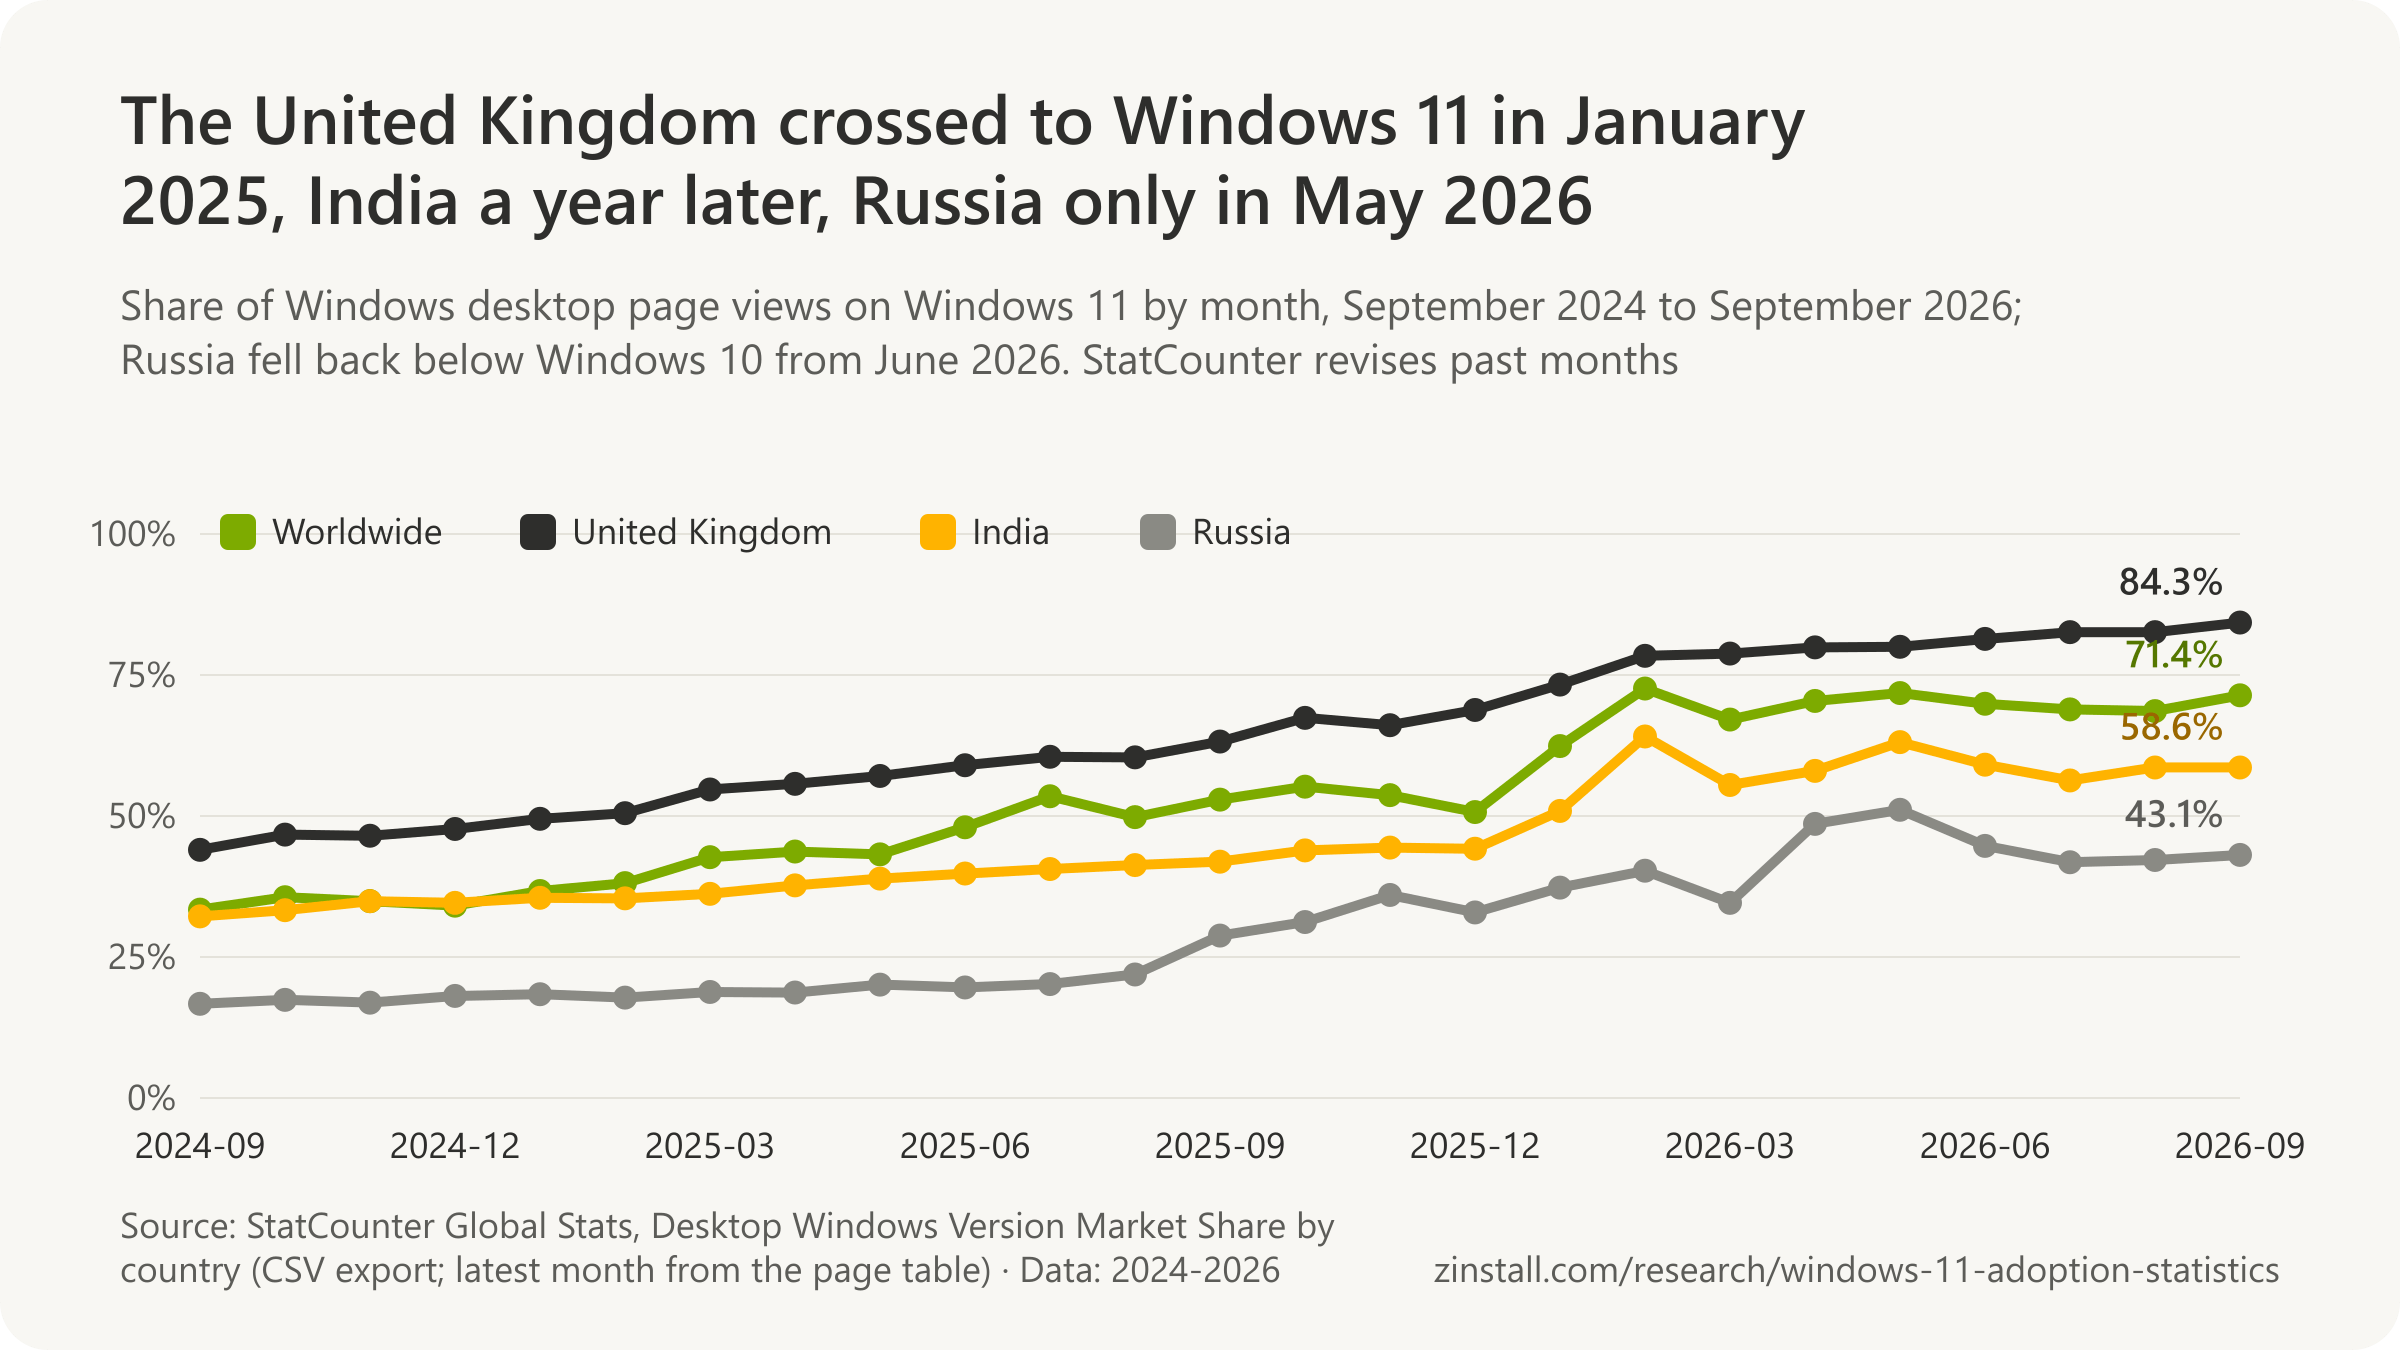
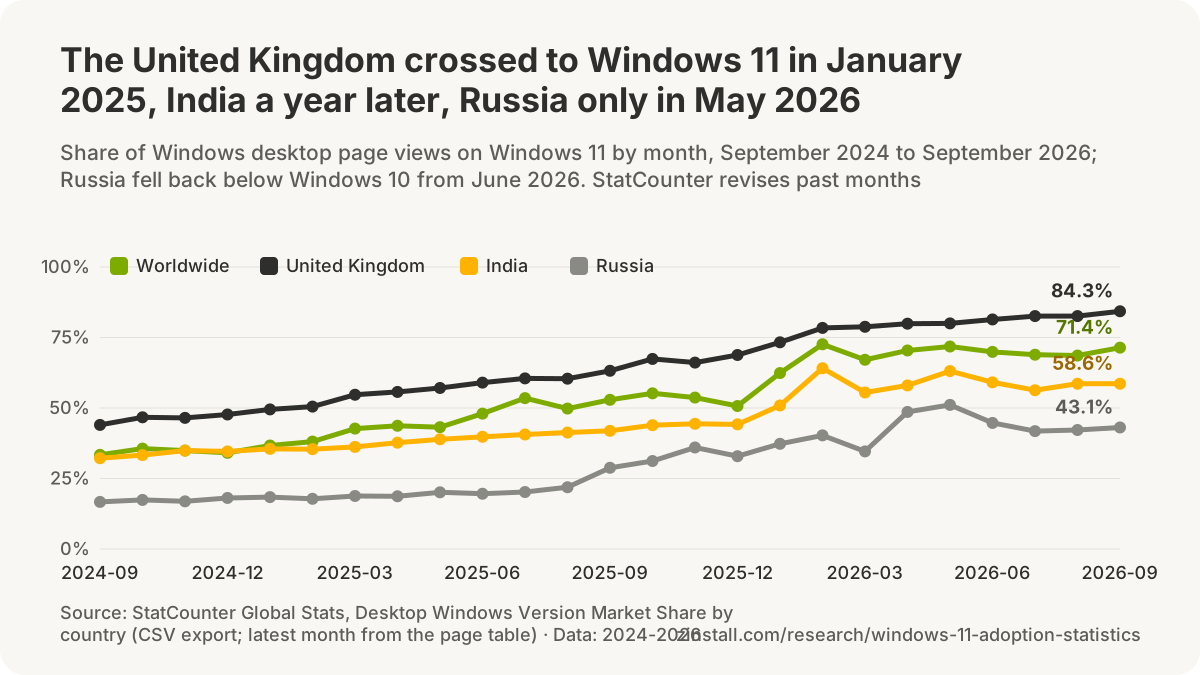
84.3% of Windows desktop page views in the United Kingdom came from Windows 11 in September 2026, the highest Windows 11 share among the 26 countries checked, with Windows 10 at 15.5% (StatCounter, 2026).
The move to Windows 11 runs at very different speeds from one country to the next, and the gap tracks how old the installed base is as much as how willing people are to change. Europe trailed the world for most of the transition and then overtook it; Russia and Indonesia crossed over in the spring of 2026 and fell back. The chart and table give StatCounter's desktop figures for each country in the latest month, and national surveys follow.

| Country or region | Windows 11 share | Scope |
|---|---|---|
| United Kingdom | 84.3% | Windows desktop devices in StatCounter's page-view sample, United Kingdom · 2026-09 |
| United States | 80.5% | Windows desktop devices in StatCounter's page-view sample, United States · 2026-09 |
| Australia | 80.5% | Windows desktop devices in StatCounter's page-view sample, Australia · 2026-09 |
| Germany | 79.8% | Windows desktop devices in StatCounter's page-view sample, Germany · 2026-09 |
| South Africa | 79.7% | Windows desktop devices in StatCounter's page-view sample, South Africa · 2026-09 |
| Sweden | 78.8% | Windows desktop devices in StatCounter's page-view sample, Sweden · 2026-09 |
| Canada | 78.7% | Windows desktop devices in StatCounter's page-view sample, Canada · 2026-09 |
| Poland | 78.1% | Windows desktop devices in StatCounter's page-view sample, Poland · 2026-09 |
| Netherlands | 78.0% | Windows desktop devices in StatCounter's page-view sample, Netherlands · 2026-09 |
| Japan | 77.6% | Windows desktop devices in StatCounter's page-view sample, Japan · 2026-09 |
| Vietnam | 76.2% | Windows desktop devices in StatCounter's page-view sample, Vietnam · 2026-09 |
| Brazil | 75.6% | Windows desktop devices in StatCounter's page-view sample, Brazil · 2026-09 |
| France | 75.0% | Windows desktop devices in StatCounter's page-view sample, France · 2026-09 |
| Saudi Arabia | 73.1% | Windows desktop devices in StatCounter's page-view sample, Saudi Arabia · 2026-09 |
| Mexico | 72.0% | Windows desktop devices in StatCounter's page-view sample, Mexico · 2026-09 |
| Italy | 71.0% | Windows desktop devices in StatCounter's page-view sample, Italy · 2026-09 |
| Nigeria | 70.0% | Windows desktop devices in StatCounter's page-view sample, Nigeria · 2026-09 |
| Spain | 68.2% | Windows desktop devices in StatCounter's page-view sample, Spain · 2026-09 |
| South Korea | 64.7% | Windows desktop devices in StatCounter's page-view sample, South Korea · 2026-09 |
| Turkey | 64.4% | Windows desktop devices in StatCounter's page-view sample, Turkey · 2026-09 |
| Argentina | 62.1% | Windows desktop devices in StatCounter's page-view sample, Argentina · 2026-09 |
| India | 58.6% | Windows desktop devices in StatCounter's page-view sample, India · 2026-09 |
| China | 53.9% | Windows desktop devices in StatCounter's page-view sample, China · 2026-09 |
| Egypt | 53.3% | Windows desktop devices in StatCounter's page-view sample, Egypt · 2026-09 |
| Indonesia | 46.7% | Windows desktop devices in StatCounter's page-view sample, Indonesia · 2026-09 |
| Russia | 43.1% | Windows desktop devices in StatCounter's page-view sample, Russia · 2026-09 |
| Worldwide | 71.4% | Windows desktop devices (desktops and laptops) in StatCounter's page-view sample · 2026-09 |
| Country or region | Windows 10 share | Scope |
|---|---|---|
| Russia | 54.3% | Windows desktop devices in StatCounter's page-view sample, Russia · 2026-09 |
| Indonesia | 53.1% | Windows desktop devices in StatCounter's page-view sample, Indonesia · 2026-09 |
| Egypt | 45.6% | Windows desktop devices in StatCounter's page-view sample, Egypt · 2026-09 |
| India | 41.2% | Windows desktop devices in StatCounter's page-view sample, India · 2026-09 |
| China | 41.1% | Windows desktop devices in China in StatCounter's page-view sample · 2026-09 |
| Argentina | 37.4% | Windows desktop devices in StatCounter's page-view sample, Argentina · 2026-09 |
| Turkey | 35.2% | Windows desktop devices in StatCounter's page-view sample, Turkey · 2026-09 |
| South Korea | 35.1% | Windows desktop devices in StatCounter's page-view sample, South Korea · 2026-09 |
| Spain | 29.8% | Windows desktop devices in StatCounter's page-view sample, Spain · 2026-09 |
| Nigeria | 29.6% | Windows desktop devices in StatCounter's page-view sample, Nigeria · 2026-09 |
| Italy | 28.6% | Windows desktop devices in StatCounter's page-view sample, Italy · 2026-09 |
| Mexico | 27.7% | Windows desktop devices in StatCounter's page-view sample, Mexico · 2026-09 |
| Saudi Arabia | 26.8% | Windows desktop devices in StatCounter's page-view sample, Saudi Arabia · 2026-09 |
| France | 24.4% | Windows desktop devices in StatCounter's page-view sample, France · 2026-09 |
| Brazil | 24.2% | Windows desktop devices in StatCounter's page-view sample, Brazil · 2026-09 |
| Vietnam | 23.4% | Windows desktop devices in StatCounter's page-view sample, Vietnam · 2026-09 |
| Poland | 21.3% | Windows desktop devices in StatCounter's page-view sample, Poland · 2026-09 |
| Netherlands | 21.1% | Windows desktop devices in StatCounter's page-view sample, Netherlands · 2026-09 |
| Japan | 21.0% | Windows desktop devices in StatCounter's page-view sample, Japan · 2026-09 |
| Sweden | 20.7% | Windows desktop devices in StatCounter's page-view sample, Sweden · 2026-09 |
| Canada | 20.5% | Windows desktop devices in StatCounter's page-view sample, Canada · 2026-09 |
| South Africa | 19.9% | Windows desktop devices in StatCounter's page-view sample, South Africa · 2026-09 |
| Germany | 19.6% | Windows desktop devices in StatCounter's page-view sample, Germany · 2026-09 |
| United States | 18.9% | Windows desktop devices in StatCounter's page-view sample, United States · 2026-09 |
| Australia | 18.6% | Windows desktop devices in StatCounter's page-view sample, Australia · 2026-09 |
| United Kingdom | 15.5% | Windows desktop devices in StatCounter's page-view sample, United Kingdom · 2026-09 |
| Worldwide | 27.8% | Windows desktop devices (desktops and laptops) in StatCounter's page-view sample · 2026-09 |
| Region and version | Share | Scope |
|---|---|---|
| Oceania, Windows 11 | 80.2% | Windows desktop devices in StatCounter's page-view sample, Oceania · Oceania · 2026-09 |
| North America, Windows 11 | 79.9% | Windows desktop devices in StatCounter's page-view sample, North America · North America · 2026-09 |
| Europe, Windows 11 | 74.5% | Windows desktop devices in StatCounter's page-view sample, Europe · Europe · 2026-09 |
| South America, Windows 11 | 73.0% | Windows desktop devices in StatCounter's page-view sample, South America · South America · 2026-09 |
| Africa, Windows 11 | 70.3% | Windows desktop devices in StatCounter's page-view sample, Africa · Africa · 2026-09 |
| Asia, Windows 11 | 62.4% | Windows desktop devices in StatCounter's page-view sample, Asia · Asia · 2026-09 |
| Oceania, Windows 10 | 19.1% | Windows desktop devices in StatCounter's page-view sample, Oceania · Oceania · 2026-09 |
| North America, Windows 10 | 19.6% | Windows desktop devices in StatCounter's page-view sample, North America · North America · 2026-09 |
| Europe, Windows 10 | 24.7% | Windows desktop devices in StatCounter's page-view sample, Europe · Europe · 2026-09 |
| South America, Windows 10 | 26.8% | Windows desktop devices in StatCounter's page-view sample, South America · South America · 2026-09 |
| Africa, Windows 10 | 29.1% | Windows desktop devices in StatCounter's page-view sample, Africa · Africa · 2026-09 |
| Asia, Windows 10 | 36.6% | Windows desktop devices in StatCounter's page-view sample, Asia · Asia · 2026-09 |
| Country or region | Windows 11 share, Sept 2025 | Scope |
|---|---|---|
| United Kingdom | 63.2% | Windows desktop devices in StatCounter's page-view sample, United Kingdom · 2025-09 |
| United States | 60.9% | Windows desktop devices in StatCounter's page-view sample, United States · 2025-09 |
| Canada | 57.1% | Windows desktop devices in StatCounter's page-view sample, Canada · 2025-09 |
| Japan | 55.4% | Windows desktop devices in StatCounter's page-view sample, Japan · 2025-09 |
| Europe | 49.5% | Windows desktop devices in StatCounter's page-view sample, Europe · 2025-09 |
| Italy | 48.6% | Windows desktop devices in StatCounter's page-view sample, Italy · 2025-09 |
| France | 45.1% | Windows desktop devices in StatCounter's page-view sample, France · 2025-09 |
| Germany | 44.1% | Windows desktop devices in StatCounter's page-view sample, Germany · 2025-09 |
| China | 42.6% | Windows desktop devices in StatCounter's page-view sample, China · 2025-09 |
| India | 41.9% | Windows desktop devices in StatCounter's page-view sample, India · 2025-09 |
| Worldwide | 52.9% | Windows desktop devices (desktops and laptops) in StatCounter's page-view sample · 2025-09 |
- 43.1% of Windows desktop page views in Russia came from Windows 11 in September 2026, the lowest Windows 11 share among the 26 countries checked, with Windows 10 at 54.3% (StatCounter, 2026).
- 74.5% of Windows desktop page views in Europe came from Windows 11 in September 2026, against 24.7% from Windows 10 (StatCounter, 2026).
- Europe's Windows 11 share of Windows desktop page views was 3.1 points above the worldwide share in September 2026, 74.5% against 71.4% (StatCounter, 2026).
- Europe's Windows 11 share of Windows desktop page views was 3.4 points below the worldwide share in September 2025, 49.5% against 52.9% (StatCounter, 2025).
- 62.4% of Windows desktop page views in Asia came from Windows 11 in September 2026, against 36.6% from Windows 10 (StatCounter, 2026).
- 80.2% of Windows desktop page views in Oceania came from Windows 11 in September 2026, against 19.1% from Windows 10 (StatCounter, 2026).
- Windows 11's share of Windows desktop page views in Germany rose by 35.7 points in a year, from 44.1% in September 2025 to 79.9% in September 2026 (StatCounter monthly series, 2026).
- Windows 11's share of Windows desktop page views in France rose by 30.1 points in a year, from 45.1% in September 2025 to 75.2% in September 2026 (StatCounter monthly series, 2026).
- Windows 11's share of Windows desktop page views in the United Kingdom rose by 21.2 points in a year, from 63.2% in September 2025 to 84.4% in September 2026 (StatCounter monthly series, 2026).
- Windows 11's share of Windows desktop page views in the United States rose by 19.7 points in a year, from 60.9% in September 2025 to 80.6% in September 2026 (StatCounter monthly series, 2026).
- Windows 11's share of Windows desktop page views in China rose by 11.2 points in a year, from 42.6% in September 2025 to 53.8% in September 2026 (StatCounter monthly series, 2026).
- Windows 11's share of Windows desktop page views in Japan rose by 22.2 points in a year, from 55.4% in September 2025 to 77.6% in September 2026 (StatCounter monthly series, 2026).
- Windows 11's share of Windows desktop page views in Italy rose by 22.4 points in a year, from 48.6% in September 2025 to 71.0% in September 2026 (StatCounter monthly series, 2026).
- Windows 11's share of Windows desktop page views in India rose by 16.7 points in a year, from 41.9% in September 2025 to 58.5% in September 2026 (StatCounter monthly series, 2026).
- Windows 11's share of Windows desktop page views in Europe rose by 25.1 points in a year, from 49.5% in September 2025 to 74.6% in September 2026 (StatCounter monthly series, 2026).
- 44.0% of Windows desktop page views in Europe came from Windows 11 in June 2025, against 53.3% from Windows 10; worldwide, Windows 11 took the lead the following month, in July 2025 (StatCounter, 2025).
- 44.5% of Windows desktop page views in Europe came from Windows 11 in July 2025, against 52.8% from Windows 10, while Windows 11 already led worldwide from July 2025 (StatCounter, 2025).
- 53.0% of Windows desktop page views in Europe still came from Windows 10 against 44.1% from Windows 11 when I Programmer read StatCounter's chart on 8 July 2025, while Windows 11 already led worldwide (I Programmer, 2025).
- 47.5% of Windows desktop page views in Europe still came from Windows 10 in September 2025, against 49.5% from Windows 11 (StatCounter, 2025).
- 35.4% of Windows desktop page views in the United States still came from Windows 10 in September 2025, against 60.9% from Windows 11 (StatCounter, 2025).
- 51.2% of Windows desktop page views in Germany still came from Windows 10 in September 2025, against 44.1% from Windows 11 (StatCounter, 2025).
- 51.0% of Windows desktop page views in China still came from Windows 10 in September 2025, against 42.6% from Windows 11 (StatCounter, 2025).
- 56.4% of Windows desktop page views in India still came from Windows 10 in September 2025, against 41.9% from Windows 11 (StatCounter, 2025).
- 42.6% of Windows desktop page views in Japan still came from Windows 10 in September 2025, against 55.4% from Windows 11 (StatCounter, 2025).
- 35.6% of Windows desktop page views in the United Kingdom still came from Windows 10 in September 2025, against 63.2% from Windows 11 (StatCounter, 2025).
- 49.4% of Windows desktop page views in France still came from Windows 10 in September 2025, against 45.1% from Windows 11 (StatCounter, 2025).
- 41.0% of Windows desktop page views in Canada still came from Windows 10 in September 2025, against 57.1% from Windows 11 (StatCounter, 2025).
- 48.5% of Windows desktop page views in Italy still came from Windows 10 in September 2025, against 48.6% from Windows 11 (StatCounter, 2025).
| Country or region | Crossover month | Scope |
|---|---|---|
| United Kingdom | January 2025 | Windows desktop devices in StatCounter's page-view sample, United Kingdom · United Kingdom · 2025-01 |
| North America | March 2025 | Windows desktop devices in StatCounter's page-view sample, North America · North America · 2025-03 |
| Japan | April 2025 | Windows desktop devices in StatCounter's page-view sample, Japan · Japan · 2025-04 |
| Worldwide | July 2025 | Windows desktop devices in StatCounter's page-view sample, Worldwide · Worldwide · 2025-07 |
| Europe | September 2025 | Windows desktop devices in StatCounter's page-view sample, Europe · Europe · 2025-09 |
| Germany | October 2025 | Windows desktop devices in StatCounter's page-view sample, Germany · Germany · 2025-10 |
| France | October 2025 | Windows desktop devices in StatCounter's page-view sample, France · France · 2025-10 |
| China | October 2025 | Windows desktop devices in StatCounter's page-view sample, China · China · 2025-10 |
| Africa | October 2025 | Windows desktop devices in StatCounter's page-view sample, Africa · Africa · 2025-10 |
| India | January 2026 | Windows desktop devices in StatCounter's page-view sample, India · India · 2026-01 |
| Russia (fell back under Windows 10 from June 2026) | May 2026 | Windows desktop devices in StatCounter's page-view sample, Russia · Russia · 2026-05 |
| Indonesia (fell back under Windows 10 from June 2026) | May 2026 | Windows desktop devices in StatCounter's page-view sample, Indonesia · Indonesia · 2026-05 |

National surveys and telemetry
- 32 million Windows computers in Germany still ran Windows 10 at the start of 2025, about 65% of all devices in German households (ESET, 2025).
- About 24 million devices in Germany still ran Windows 10 in August 2025, about 8 million fewer than at the start of the year (ESET, 2025).
- About 21 million PCs in German private households still ran Windows 10 in January 2026, down about 3.7 million since August 2025 (ESET, 2026).
- 48.5% of Windows PCs in German private households still ran Windows 10 in January 2026 (ESET says 'over 48 percent'), about 21 million devices, against 49.5% on Windows 11 (ESET, 2026).
- 21 million people in the UK still owned and used a laptop or computer running Windows 10 in September 2025, by Which?'s estimate from a survey of 2,008 adults (Which?, 2025).
- 39.0% of UK adults surveyed in September 2025 said they use Windows 10 (Which?, 2025).
- 39% of British adults still used a computer running Windows 10 on the day support ended, per YouGov polling of 2,215 adults for The Restart Project (The Restart Project, 2025).
- 13 million computers in the UK were left without Microsoft software support from 14 October 2025, The Restart Project estimated from its YouGov polling (The Restart Project, 2025).
- 68.1% of Japanese companies surveyed in August 2025 had already deployed Windows 11, with 19.0% not yet deployed and 9.5% unable to say (Nork Research, 2025).
- 19.0% of Japanese companies surveyed in August 2025 had not deployed Windows 11 two months before Windows 10's end of support (Nork Research, 2025).
- 22% of surveyed Euroconsumers members in Belgium, Italy, Spain and Portugal still ran Windows on a PC or laptop from 2017 or earlier, which cannot be upgraded to Windows 11, in the organisation's 2025 survey of over 12,000 members (Euroconsumers, 2025).
- 38.0% of endpoints in Australia that received support through TeamViewer between July and September 2025 still ran Windows 10, slightly below the global figure of over 40% (TeamViewer via IT Brief Australia, 2025).
- Over 35 million PCs in Germany, Austria and Switzerland together still ran Windows 10 at the start of 2025 (ESET, 2025).
- The number of Windows 10 PCs in Germany fell by about 8 million between January and August 2025, from about 32 million to about 24 million (ESET, 2025).
- Windows 10 installations in German private households fell by about 3.7 million between August 2025 and January 2026, almost all of them moving to Windows 11 according to ESET (ESET, 2026).
- 24.7 million PCs in German households, companies, public bodies and organisations still ran Windows 10 in August 2025, almost 57% of all Windows PCs, according to dpa's corrected report of ESET's calculation (dpa, 2025).
- 17.9 million PCs in Germany had Windows 11 installed in August 2025, 8% more than in November 2024, according to dpa's report of ESET's calculation (dpa, 2025).
- 5.4 million Windows 10 devices could still be in use in the UK after 14 October 2025, as TechRadar restated Which?'s 5.4 million people (TechRadar, 2025).
- 24.4% of Japanese companies surveyed in August 2025 had deployed Windows 11 but expected Windows 10 PCs to remain in use after its end of support (Nork Research, 2025).
- 31.7% of Japanese companies surveyed in August 2025 had deployed Windows 11 and planned to have no Windows 10 PCs left by its end of support (Nork Research, 2025).
- 11.9% of Japanese companies surveyed in August 2025 had deployed Windows 11 but did not know how much Windows 10 remained (Nork Research, 2025).
| Release | Windows 10 share | Scope |
|---|---|---|
| January 2025 | 65.0% | Windows PCs in German private households (ESET telemetry; dpa reports the figures were cross-checked against StatCounter) · Germany · 2025-01 |
| August 2025 | 56.0% | Windows PCs in German private households (ESET telemetry; dpa reports the figures were cross-checked against StatCounter) · Germany · 2025-08 |
| January 2026 | 48.5% | Windows PCs in German private households (ESET telemetry; dpa reports the figures were cross-checked against StatCounter) · Germany · 2026-01 |
- 10.2 million PCs in Germany ran Windows 10 in January 2026 according to dpa's restatement of ESET's study, a figure that contradicts ESET's own 21 million (dpa, 2026).
- 48.5% of all Windows PCs in German private households, about 10.2 million of roughly 21 million, still ran Windows 10 in January 2026 according to PC-WELT's reading of ESET (PC-WELT, 2026).
- 48.5% of the roughly 21 million Windows PCs in German private households still ran Windows 10 in January 2026, as dpa restated ESET's study (dpa, 2026).
- About 48% of private Windows PCs in Germany, about 21 million devices, still ran Windows 10 in January 2026, with Windows 11 at about 49.5%, as Igor's Lab reported ESET's study (Igor's Lab, 2026).
- Over 48% of the roughly 21 million desktop computers in German private households still ran Windows 10 in January 2026, as Borncity summarised ESET's release (Borncity, 2026).
- 81.4% of Windows desktop page views in Brazil came from Windows 11 in September 2025, against 17.3% from Windows 10 (StatCounter, 2025).
- 17.3% of Windows desktop page views in Brazil still came from Windows 10 in September 2025, against 81.4% from Windows 11 (StatCounter, 2025).
- 9.6% of Windows desktop page views in Brazil were attributed to Windows 7 in December 2025, against 1.0% in July 2025 and 0.1% in September 2026 (StatCounter, 2026).
Sources: StatCounter Global Stats (2026); StatCounter (2025, 2026); I Programmer; ESET Deutschland GmbH (2025, 2026); Which?; The Restart Project; Nork Research Co., Ltd.; Euroconsumers; IT Brief Australia; dpa-AFX; TechRadar; dpa; PC-WELT; Igor's Lab; Borns IT- und Windows-Blog
What percentage of businesses have upgraded to Windows 11?
- Education led in June 2025, with 77% of its endpoints on Windows 11, against 73% in technology and 41% in healthcare.
- HP's chief financial officer put the Windows 11 refresh at roughly 70% complete in late August 2026.
- Only 47% to 50% of commercial PCs worldwide were on Windows 11 in early October 2025, close to 60% in the United States.
- 72% of organisations planned to wait until a year or less before the deadline to move to Windows 11, in an April 2024 survey.
| Population (tracker) | Windows 11 share |
|---|---|
| Steam gamers (Valve survey) | 63.0% |
| Business fleet devices (Lansweeper audit) | 60.1% |
| Desktop web traffic worldwide (StatCounter) | 52.9% |
| Kaspersky users (Kaspersky Security Network) | 33% |
Sources: Lansweeper (2026, 2025, 2023); ControlUp; HP Inc.; The Register (2025, 2024, 2022); SHI International; Valve; StatCounter; Kaspersky; Silicon UK; Borncity
More statistics (35)
Windows 11 became the majority operating system across the millions of endpoints ControlUp monitors around mid-May 2025 (ControlUp, 2025).
Gamers moved first because their hardware was newest; managed business fleets moved last because every application had to be tested and every ineligible machine replaced, then caught up fast in the final months. Putting the enterprise audits beside the consumer trackers at the same dates shows the gap and how it closed, and the PC makers' own calls give the view from the installed base they sell into.
- 49.2% of Steam survey participants ran Windows 11 in August 2024, overtaking Windows 10 (47.1%) for the first time in the Steam survey (Valve Steam Hardware and Software Survey, 2024).
- Windows 11 first exceeded Windows 10 in Windows desktop page views worldwide in July 2025, at 53.5% against 42.9% (StatCounter, 2025).
- 77% of enterprise endpoints in education and 73% in technology were already running Windows 11 in June 2025, against 41% in healthcare and 45% in finance, in ControlUp's sample of over one million endpoints (ControlUp, 2025).
- 43% of enterprise endpoints in the Americas had been upgraded to Windows 11 by June 2025, against 70% in Europe and 66% in other regions, even though 87% of the Americas devices were Windows 11-ready (ControlUp, 2025).
- 42% of migrations had been completed at very large organisations (over 10,000 Windows devices) in ControlUp's June 2025 sample, the least prepared group (ControlUp, 2025).
- 21.4% of Windows machines at small and medium businesses in Lansweeper's data still ran Windows 10 in July 2026, against 16.6% at enterprise scale (Lansweeper, 2026).
- 59.5% of corporate devices in Kaspersky Security Network data still ran Windows 10 in September 2025, against 51% in small businesses, with Windows 7 slightly above 6% in both groups (Kaspersky, 2025).
- 47% to 50% of commercial PCs worldwide were on Windows 11 in early October 2025, close to 60% in the US and perhaps 65% in EMEA, according to Omdia analyst Kieren Jessop (The Register, 2025).
- 40% of HP's PC installed base was still on Windows 10 at the end of HP's fiscal fourth quarter 2025 (October 2025), so the Windows 11 refresh would remain a tailwind into 2026, HP said (HP, 2025).
- Roughly 30% of the installed base was still on Windows 10 in late May 2026, HP's CFO said, with the Windows 11 refresh in EMEA and APJ 'now on par with North America' (HP, 2026).
- Roughly 70% of the Windows 11 refresh was complete by late August 2026, HP's CFO said, adding that it still drove small and medium business demand (HP, 2026).
- 10 to 12 percentage points behind: the Windows 11 transition at Windows 10's end of support lagged where the Windows 10 transition stood at the previous end of support, Dell's COO said in November 2025 (Dell, 2025).
- 190,000 Microsoft employee devices were upgraded to Windows 11 in five weeks in the company's internal rollout, described as the fastest OS deployment in its history (Microsoft Inside Track, 2022).
- 99 percent of qualifying Microsoft devices received Windows 11 within the five-week internal rollout (Microsoft Inside Track, 2022).
- 35% of channel partners polled by Canalys said their small and medium-sized business customers were either unaware of the Windows 10 end-of-service deadline or had no plans to upgrade their PCs, as reported in April 2025 (Canalys via TechRadar, 2025).
- 72% of organizations planned to hold off updating to Windows 11 until within one year or less of the Windows 10 end-of-support date, in a 2024 survey by the reseller SHI (SHI, 2024; sample not stated).
- Slightly more than 50% of HP's PC installed base had been converted to Windows 11 by August 2025, HP's CEO estimated on the fiscal third-quarter 2025 earnings call (HP, 2025).
- HP's installed-base conversion to Windows 11 ran at about 10 percentage points in the quarter to October 2025, HP's CEO said (HP, 2025).
- 60% of the Windows 11 refresh had been completed by late February 2026, HP's CFO estimated on the company's fiscal first-quarter call (HP, 2026).
- 'We have not completed the Windows 11 transition,' Dell's COO told analysts six weeks after Windows 10 support ended, calling the remaining base a rich refresh opportunity (Dell, 2025).
- 'We were lagging in Windows 11 refresh and caught up through the quarter against historical refreshes,' Dell's COO said in May 2026, six months after calling the transition 10 to 12 points behind (Dell, 2026).
- The PC refresh remains 'a meaningful opportunity, given the large installed base of devices that are over four and five years old', Dell's COO said on 26 February 2026, three months after his 500 million figures (Dell, 2026).
- About a third of all Windows devices would be on Windows 11 if Dell's two 500 million figures are set against Microsoft's 1.4 billion, Computerwoche reckoned while calling Dell's sources unclear; the arithmetic gives about 29%, and a third follows only from Dell's own 1.5 billion base (Computerwoche, 2025).
- 'A significant portion of the global Windows installed base remains either on Windows 10 or on a PC that is five or more years old,' Omdia's research director said five days before end of support (Omdia, 2025).
- 14% of SMB customers were completely unaware of the Windows 10 end-of-service deadline, according to channel partners polled by Canalys in April 2025 (Canalys via TechRadar, 2025).
- No measured increase in support tickets was recorded during Microsoft's 190,000-device Windows 11 rollout, according to the company's internal IT team (Microsoft Inside Track, 2022).
- The Register restated ControlUp's August 2024 study as 88% of the endpoints not already on Windows 11 being ready to upgrade and 82% of the more than 750,000 devices yet to make the jump (The Register, 2024).
- TechRadar restated ControlUp's August 2024 figures as 88% of those yet to upgrade able to move to Windows 11, 82% yet to make the leap, 11% needing full replacement and 1% requiring an upgrade (TechRadar, 2024).
- Windows 11 devices in Nexthink's customer data showed system crashes on 1.2% of devices against 0.6% for Windows 10, and hard resets on 9.9% against 8.5%, in 2025 (Nexthink, 2025).
| Population (tracker) | Windows 11 share | Scope |
|---|---|---|
| Steam gamers (Valve survey) | 63.0% | Steam users who took part in Valve's voluntary monthly hardware and software survey · Worldwide · 2025-09 |
| September 2025 (over 8 million devices) | 60.1% | over 8 million Windows devices scanned by Lansweeper customers · Worldwide · 2025-09 |
| Desktop page views worldwide (StatCounter) | 52.9% | Windows desktop devices (desktops and laptops) in StatCounter's page-view sample · Worldwide · 2025-09 |
| Kaspersky users (Kaspersky Security Network) | 33% | consenting Kaspersky Security Network users (all segments) · Worldwide · 2025-09 |
| Call | Figure | Scope |
|---|---|---|
| August 2025: installed base converted to Windows 11 | slightly over 50% | HP Inc.'s own estimate of its PC installed base (manufacturer statement on an earnings call) · Worldwide · 2025-Q3 |
| November 2025: installed base still on Windows 10 | 40% | HP Inc.'s own estimate of its PC installed base (manufacturer statement on an earnings call) · Worldwide · 2025-Q4 |
| February 2026: Windows 11 refresh complete | about 60% | PC installed base due for Windows 11 refresh as HP describes it (base not defined on the call) · Worldwide · 2026-02 |
| May 2026: installed base still on Windows 10 | roughly 30% | PC installed base as HP describes it (base not defined on the call) · Worldwide · 2026-05 |
| August 2026: Windows 11 refresh complete | roughly 70% | PC installed base due for Windows 11 refresh as HP describes it (base not defined on the call) · Worldwide · 2026-08 |
Sources: ControlUp (2025); Valve; StatCounter Global Stats; Lansweeper (2025, 2026); Kaspersky; The Register (2024, 2025); HP Inc. (2025, 2026); Dell Technologies (2025, 2026); Microsoft; Canalys; SHI International; Computerwoche; Omdia; TechRadar; Nexthink; StatCounter
How many PCs can't upgrade to Windows 11?
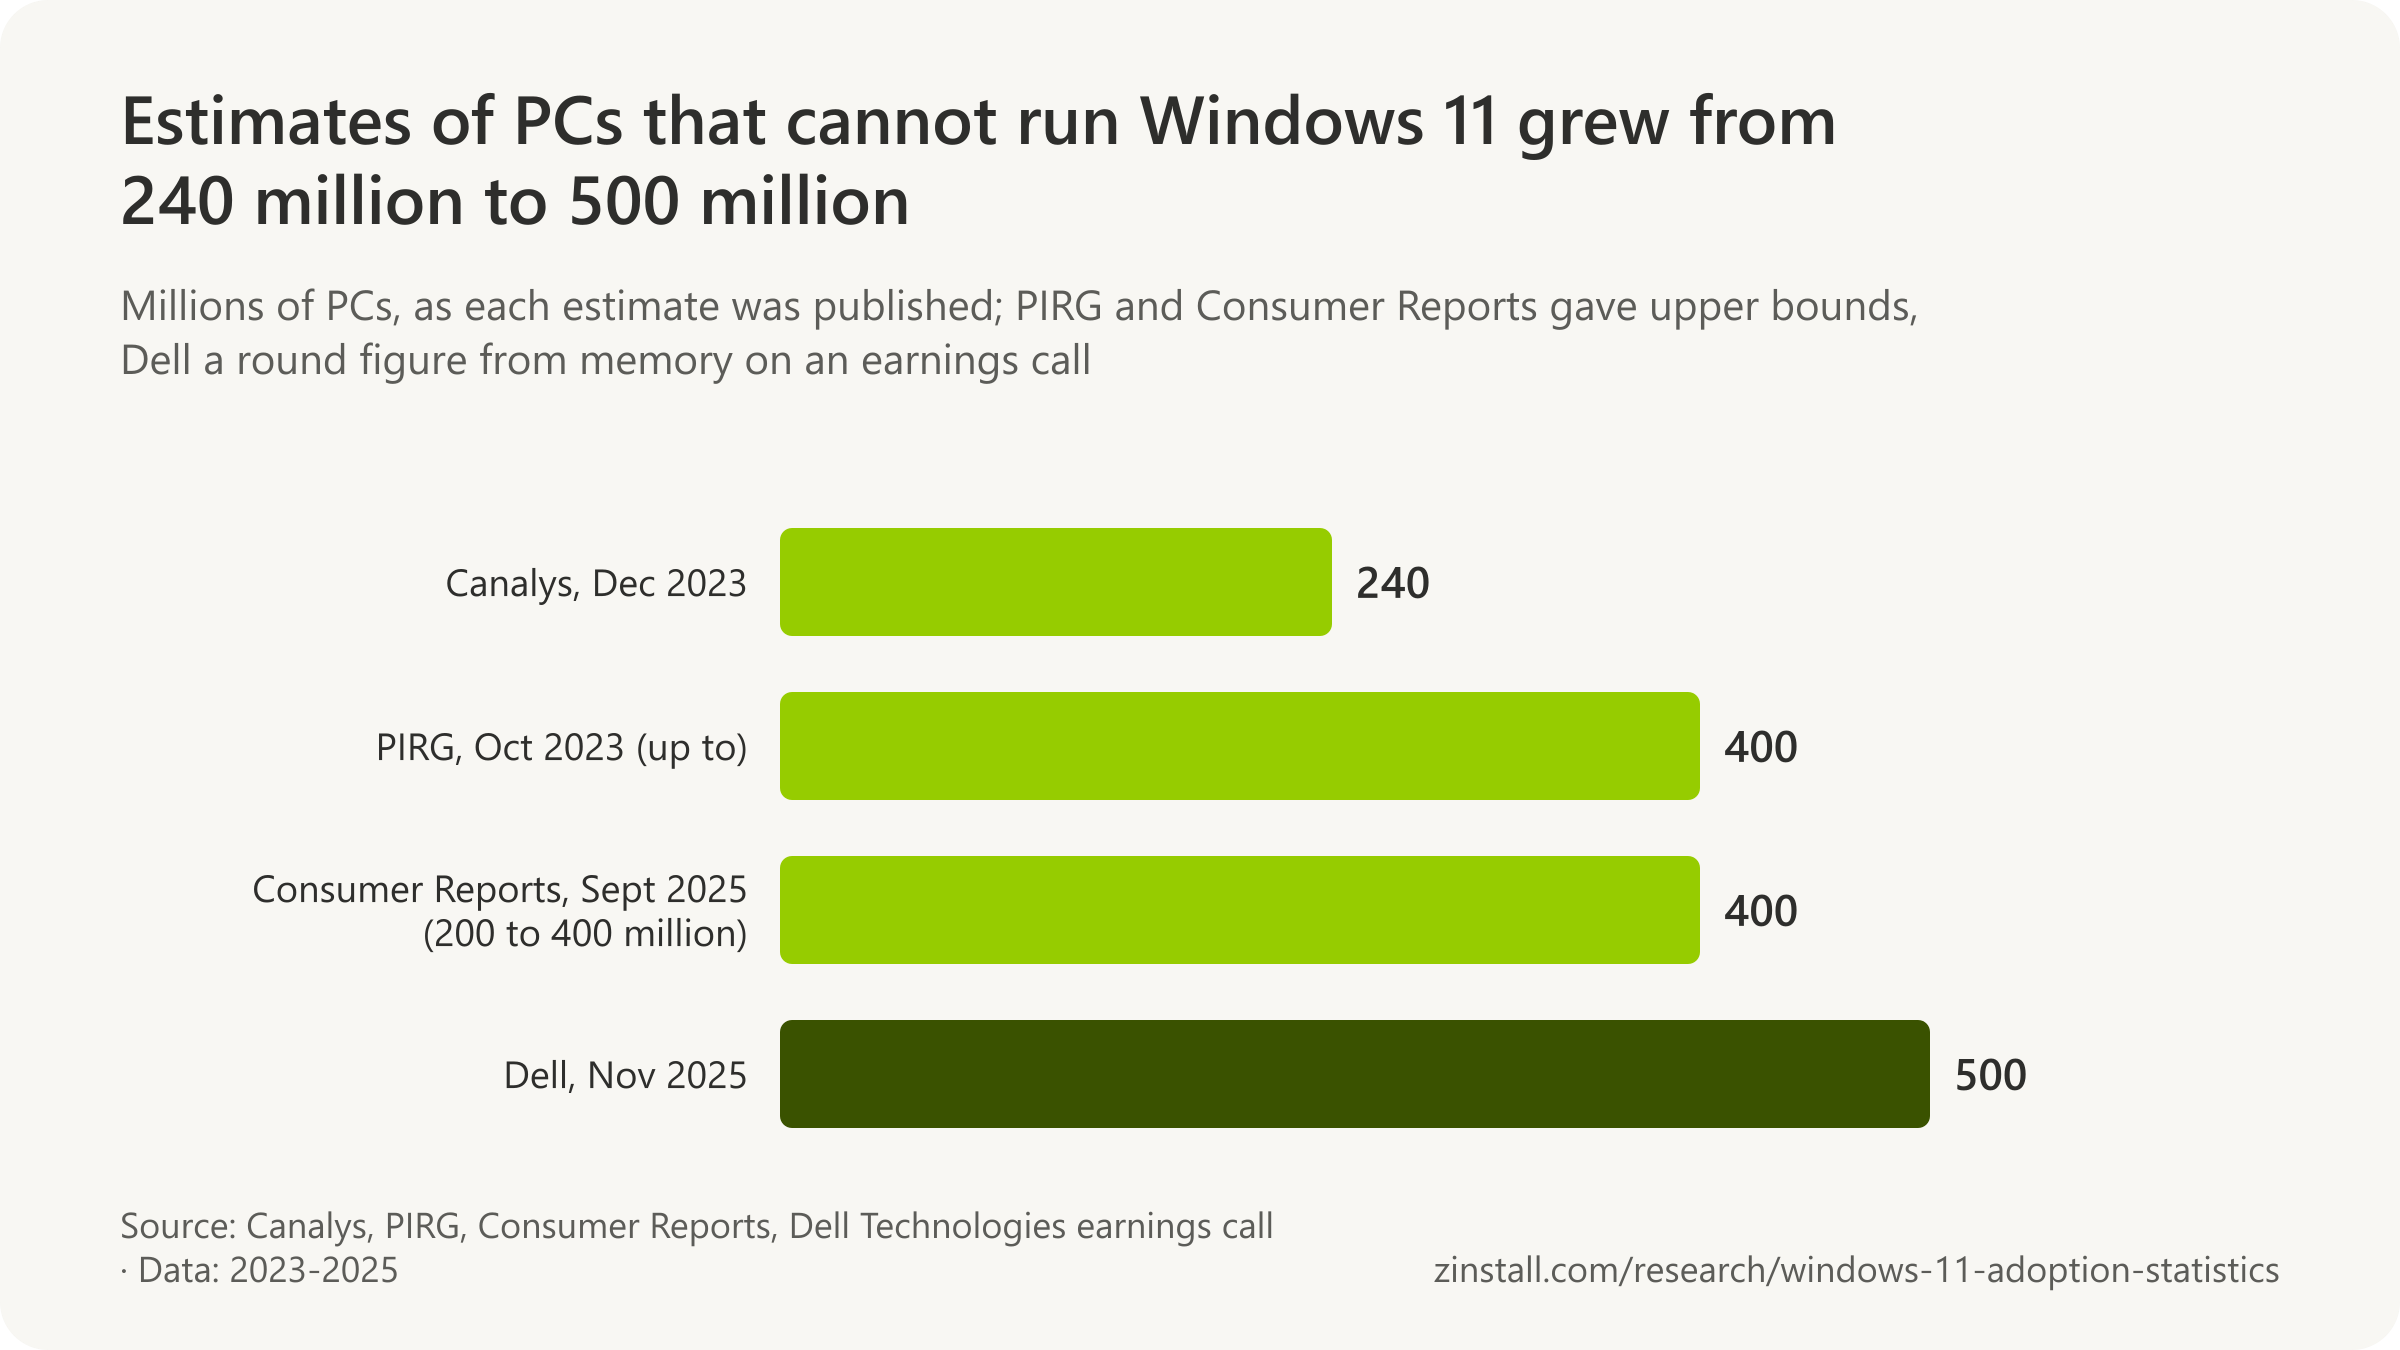
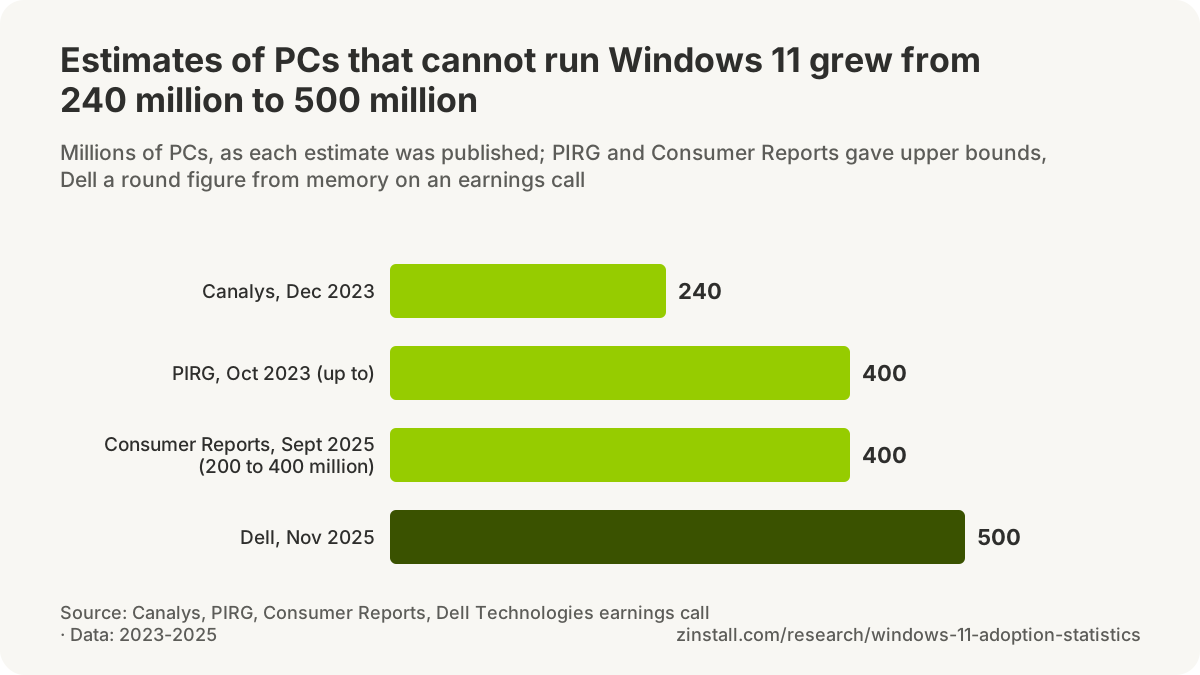
500 million PCs in use are too old to run Windows 11, out of about 1.5 billion, one PC maker estimated (Dell, 2025).

- Another 500 million PCs could run Windows 11 but had not been upgraded, by the same estimate.
- An earlier analyst estimate, from December 2023, put the PCs that cannot run Windows 11 at 240 million.
- 87% of business PCs not yet on Windows 11 were hardware-ready to move in March 2025; 13% needed replacing.
- Only 2.8% of the Windows 10 PCs left in audited business fleets in July 2026 failed Windows 11's hardware requirements.
- In an October 2022 audit of business PCs, 43% could not upgrade to Windows 11, and only 57% had an eligible processor.
| Estimate and population | Figure |
|---|---|
| PIRG, Oct 2023: of about 1 billion Windows 10 devices (advocacy estimate, 'up to') | up to 400 million |
| Consumer Reports, Sept 2025: PCs worldwide that cannot be upgraded (estimate range) | 200 to 400 million |
| Euroconsumers, June 2025: surveyed consumers on PCs from 2017 or earlier (cannot take Windows 11) | 22% |
| Lansweeper, Oct 2023: workstations eligible for the automatic upgrade (about 33 million audited) | 67.6% |
| ControlUp, Aug 2024: of endpoints not yet on Windows 11, need full replacement (750,000+ sample) | 11% |
| Omdia, Oct 2025: of corporate machines missing the deadline, fail the hardware requirements | about 20% |
Sources: Dell Technologies; Canalys; ControlUp (2025, 2024); Lansweeper (2026, 2023); TechRadar; U.S. PIRG; Consumer Reports; Euroconsumers; The Register
More statistics (53)
500 million PCs of the roughly 1.5 billion-unit installed base Dell described are four years old and cannot run Windows 11, per Dell's COO in November 2025 (Dell, 2025).
Windows 11 requires a TPM 2.0 chip, UEFI Secure Boot and a processor from a list that starts around 2018, so a large part of the Windows 10 base can never take the free upgrade. The estimates of how large come from different populations, measured in different years, and the table names each one's denominator. The oldest machines are leaving the fleets fastest, so the share that is ineligible among the remaining Windows 10 PCs is far smaller in the business audits than in the consumer estimates.
- 500 million PCs of the roughly 1.5 billion-unit installed base Dell described are capable of running Windows 11 but had not been upgraded as of November 2025, per Dell's COO (Dell, 2025).
- 1.5 billion units is the size of the PC installed base Dell COO Jeff Clarke gave from memory on the company's 25 November 2025 earnings call (Dell, 2025).
- 33% (roughly one third) of the PC installed base consisted of devices four years or older in May 2026, Dell's COO said, describing the remaining refresh runway (Dell, 2026).
- 240 million PCs will become e-waste because they cannot run Windows 11, Canalys estimated in December 2023 for the period to Windows 10's end of support on 14 October 2025 (Canalys, 2023).
- 20% ('roughly a fifth') of PCs in use were expected to become e-waste through incompatibility with Windows 11 by October 2025, Canalys estimated in December 2023 (Canalys, 2023).
- 400 million ('up to') of the 1 billion Windows 10 devices in use would lose support at Windows 10's end of life, PIRG said when delivering 20,000 petition signatures in October 2023 (PIRG, 2023).
- 43% of computers running Windows 10 could not move to Windows 11 in 2022, 'around 400 million computers at that time', is the derivation behind PIRG's 400 million figure (PIRG, 2025).
- 200 million to 400 million PCs worldwide cannot be upgraded to Windows 11, Consumer Reports told Microsoft's CEO in September 2025, giving a range rather than a point estimate (Consumer Reports, 2025).
- 22% of surveyed Euroconsumers members in Belgium, Italy, Spain and Portugal still ran Windows on a PC or laptop from 2017 or earlier, which cannot be upgraded to Windows 11, in the organisation's 2025 survey of over 12,000 members (Euroconsumers, 2025).
- 22.6% of Test-Achats members surveyed owned a computer bought in 2017 or earlier, and 80% of those computers ran Windows, in the Belgian consumer organisation's 2025 survey (Test-Achats, 2025).
- 44.4% of the 30 million Windows devices Lansweeper scanned across 60,000 enterprises in its first Windows 11 readiness audit were Windows 11-ready and 55.6% were not, with 91% passing the RAM test but only about half of workstation TPMs meeting the requirement (Computer Weekly, 2022).
- TechRadar restated Lansweeper's October 2022 audit as 43% of business devices unable to upgrade to Windows 11, only 57% with eligible CPUs and 35% of workstations with incompatible or disabled TPM (TechRadar, 2022).
- 67.6% of workstations in Lansweeper's October 2023 audit of an estimated 33 million Windows devices were eligible for the automatic Windows 11 upgrade, leaving 32.4% ineligible (Lansweeper, 2023).
- 40% of 3.12 million anonymised corporate devices across 457 organisations were ready for Windows 11, and over 60% were not, in Nexthink's 2022 analysis (Nexthink, 2022).
- 88% of the enterprise endpoints not yet on Windows 11 in ControlUp's August 2024 sample were hardware-ready to migrate, 1% could be upgraded to meet the requirements and 11% needed full replacement (ControlUp, 2024).
- 11% of the enterprise endpoints not yet on Windows 11 in ControlUp's August 2024 sample needed to be fully replaced to run it (ControlUp, 2024).
- 87% of the enterprise endpoints not yet on Windows 11 in ControlUp's March 2025 sample of 1.1 million devices were hardware-ready to migrate and 13% needed replacement (ControlUp, 2025).
- 19% of healthcare endpoints in ControlUp's June 2025 sample needed to be replaced entirely before they could support Windows 11, against 3% in finance (ControlUp, 2025).
- Around 20% of the corporate machines expected to miss the Windows 10 deadline did not meet Windows 11's hardware requirements (TPM 2.0 and a supported CPU), per Omdia's Kieren Jessop; the rest were held back by budgets and lack of compelling features (The Register, 2025).
- 62% of devices, on average, had been or would need to be replaced or upgraded to be compatible with Windows 11 at the 200 UK and German organisations surveyed in March 2025 (Panasonic TOUGHBOOK, 2025).
- 2.8% of the Windows 10 devices remaining in Lansweeper's customer fleets in July 2026 sat on hardware that does not meet Windows 11's requirements, so most holdouts could upgrade (Lansweeper, 2026).
- 40% of PCs in use could not upgrade to Windows 11, PIRG asserted in October 2023, rounding a 2022 enterprise-scan figure to the whole installed base (PIRG, 2023).
- 400 million Windows 10 computers 'will not be allowed to upgrade to Windows 11', Right to Repair Europe said in September 2025, describing Windows 10 as running on almost half of all Windows computers (Right to Repair Europe, 2025).
- 76% of PCs sold between 2006 and 2021 could not run Windows 11 by Ed Tittel's sales-based estimate of June 2021, which he conceded might be closer to 50-50 for PCs in regular use (Ed Tittel, 2021).
- 1.16 billion PCs were sold from 2018 through 2021, the cohort Ed Tittel treated as Windows 11-eligible by CPU generation, against 3.62 billion sold 2006 to 2017 (Ed Tittel, 2021).
- 57% of channel partners surveyed by Canalys expected the end of Windows 10 support to affect customers' refresh plans in 2024 (Canalys, 2023).
- 33% (one in three) of devices were expected to be replaced within two years, per Canalys' channel partner survey in December 2023 (Canalys, 2023).
- 93.9% of workstations in Lansweeper's October 2023 audit passed the Windows 11 RAM test, while 74.8% of workstation TPMs met the requirement, just under 9.0% failed and 16.4% were not TPM-compatible or had it disabled (Lansweeper, 2023).
- 42.8% of CPUs in the workstations Lansweeper audited in October 2022 were not certified for Windows 11, 7.2% had less than the 8 GB of RAM Lansweeper used as its threshold (Windows 11 itself requires 4 GB) and 14.7% lacked TPM support, with a further 20.8% failing the TPM test or having TPM disabled (Lansweeper via Borncity, 2022).
| Estimate and population | Figure | Scope |
|---|---|---|
| Canalys, Dec 2023: PCs in use that cannot run Windows 11 (about a fifth of the base) | 240 million | PCs in use at the end of 2023, Canalys estimate · Worldwide · 2023-12 |
| PIRG, Oct 2023: of about 1 billion Windows 10 devices (advocacy estimate, 'up to') | up to 400 million | Windows 10 devices in use (PIRG's 1 billion denominator) · Worldwide · 2023-10 |
| Consumer Reports, Sept 2025: PCs worldwide that cannot be upgraded (estimate range) | 200 to 400 million | PCs worldwide running Windows 10 that fail Windows 11's hardware requirements · Worldwide · 2025-09 |
| Dell COO, Nov 2025: four years old and cannot run Windows 11, of a ~1.5 billion installed base | 500 million | Worldwide PC installed base of roughly 1.5 billion units as Dell's COO described it · Worldwide · 2025-11 |
| Dell COO, Nov 2025: capable of Windows 11 but not upgraded, of the same base | 500 million | Worldwide PC installed base of roughly 1.5 billion units as Dell's COO described it · Worldwide · 2025-11 |
| Euroconsumers, June 2025: surveyed consumers on PCs from 2017 or earlier (cannot take Windows 11) | 22% | members of Euroconsumers' national consumer organisations in Belgium, Italy, Spain and Portugal who own Windows devices and answered its survey (over 12,000 respondents; self-selected, not nationally representative) · Belgium, Italy, Spain, Portugal · 2025-06 |
| Lansweeper, Oct 2023: workstations eligible for the automatic upgrade (about 33 million audited) | 67.6% | workstations among an estimated 33 million Windows devices scanned by Lansweeper customers · Worldwide · 2023-10 |
| ControlUp, Aug 2024: of endpoints not yet on Windows 11, need full replacement (750,000+ sample) | 11% | enterprise Windows endpoints not yet migrated to Windows 11 among over 750,000 managed by ControlUp · Worldwide · 2024-08 |
| ControlUp, Mar 2025: of endpoints not yet on Windows 11, hardware-ready (1.1 million sample) | 87% | enterprise Windows endpoints not yet migrated to Windows 11 among 1.1 million managed by ControlUp customers · Worldwide · 2025-03 |
| Omdia, Oct 2025: of corporate machines missing the deadline, fail the hardware requirements | about 20% | corporate PCs not migrated to Windows 11 by October 2025 (Omdia estimate) · Worldwide · 2025-10 |
| Lansweeper, July 2026: of the Windows 10 devices still in its fleets, on hardware that fails Windows 11 | 2.8% | Windows 10 devices in Lansweeper's HVMND data · Worldwide · 2026-07 |
What Windows 11 requires
- TPM 2.0, UEFI Secure Boot-capable firmware, 4 GB of memory, 64 GB of storage and a 1 GHz two-core compatible 64-bit processor are Windows 11's minimum hardware requirements, unchanged on Microsoft Learn as of July 2026 (Microsoft, 2026).
- Intel 8th-generation, AMD Zen 2 and Qualcomm 7 and 8 series processors were named by Microsoft on 28 June 2021 as the CPU floor meeting Windows 11's security and reliability principles (Microsoft, 2021).
- Intel Core X-series, Xeon W-series and the Core i7-7820HQ (select devices) were the only 7th-generation additions to Windows 11's supported CPU list after Microsoft's testing, with AMD Zen 1 excluded (Microsoft, 2021).
- 52% more kernel mode crashes were recorded on Windows Insider devices that did not meet Windows 11's minimum requirements than on those that did, Microsoft reported in August 2021 (Microsoft, 2021).
- 99.8% crash-free experience was reported by Microsoft for Windows Insider devices that met Windows 11's minimum requirements in August 2021 (Microsoft, 2021).
- Installing Windows 11 on hardware below the minimum requirements 'isn't recommended' and such devices 'aren't guaranteed to receive updates, including but not limited to security updates', Microsoft's support article states (Microsoft, 2024).
- Only Windows 10 PCs running version 22H2 that meet the minimum hardware specifications can take the free upgrade to Windows 11, checked through Windows Update (Microsoft, 2025).
- The PC Health Check app gives Windows 10 PCs a comprehensive eligibility check against the Windows 11 minimum system requirements and explains why a device is or is not eligible (Microsoft, 2025).
- Windows 11 minimum requirements are a 1 GHz or faster processor with two or more cores on a compatible 64-bit processor, 4 GB of RAM, 64 GB of storage, UEFI firmware with Secure Boot capability and TPM version 2.0 (Microsoft, 2026).
- Microsoft's upgrade FAQ states that upgrades from Windows 10 to Windows 11 are free for devices that meet the Windows 11 minimum system requirements, though internet providers may charge for the large download on metered connections (Microsoft, 2025).
- 17% more app hangs and 43% more first-party app crashes were seen on unsupported hardware in Windows 11 previews, Microsoft said in August 2021 (Microsoft, 2021).
- 'Your PC will no longer be supported and won't be entitled to receive updates' and damage 'aren't covered under the manufacturer warranty' is the disclaimer Windows 11's installer shows on unsupported PCs (Microsoft, 2024).
- Windows 11's supported Intel processor list 'represent[s] the processor models which meet the minimum floor for the supported processor generations', starting at Celeron and Pentium parts of the 8th-generation era, per Microsoft Learn (updated 30 October 2025) (Microsoft, 2025).
- Snapdragon 850 devices 'may not be manufactured with Windows 11 pre-installed and may only be upgraded to Windows 11 by a customer', the one footnoted exception on Microsoft's Qualcomm support list (Microsoft, 2025).
- 500 million PCs 'can't run Windows 11, while the same number didn't need an upgrade' is how The Register rendered Dell's two halves, omitting the 1.5 billion base and the 'not yet upgraded' wording (The Register, 2025).
- 500 million PCs cannot run Windows 11 was the only half of Dell's statement TechRadar carried, adding that most could not be made eligible and rendering '10 to 12 points' as '10% to 12%' (TechRadar, 2025).
- 500 million PCs 'could receive Windows 11' was Heise's headline for Dell's capable-but-not-upgraded half, with the transcript quoted in full including the 1.5 billion base (Heise, 2025).
- 1 billion PCs 'still stuck on Windows 10' is Pureinfotech's reading of Dell's two 500 million figures, which the transcript does not support because Clarke never said what OS the capable half runs (Pureinfotech, 2025).
- 46.2% of 'people worldwide' were still using Windows 10 in August 2025, Consumer Reports wrote to Microsoft's CEO, citing StatCounter's desktop share as a share of people (Consumer Reports, 2025).
- 646.8 million people were on Windows 10 by Consumer Reports' arithmetic (46.2% of Microsoft's 1.4 billion), a figure that multiplies a page-view share by a device count (Consumer Reports, 2025).
- 550 million corporate machines still used Windows 10 and half could not upgrade to Windows 11, according to an Omdia estimate reported by Tom's Guide in October 2025; the Omdia document itself was not found (Tom's Guide, 2025).
- The Register reported Lansweeper's October 2022 audit of an estimated 27 million PCs across 60,000 organisations as 42.8% failing the CPU test, 71.5% failing the RAM test (apparently a misreading of Lansweeper's 7.15%) and 14.7% failing the TPM test (The Register, 2022).
- 1.6 billion pounds of e-waste 'have entered the graveyard' is PIRG's November 2025 restatement of its own September estimate, which had said the End of 10 'could result in' that amount (PIRG, 2025).
Sources: Dell Technologies (2025, 2026); Canalys; U.S. PIRG (2023, 2025); Consumer Reports; Euroconsumers; Test-Achats; Computer Weekly; TechRadar (2022, 2025); Lansweeper (2023, 2026); Nexthink; ControlUp (2024, 2025); The Register (2022, 2025); Panasonic TOUGHBOOK; Right to Repair Europe; Ed Tittel; Borncity; Microsoft (2021-2026); heise online; Pureinfotech; Tom's Guide
What are Windows 10 users doing after the end of support?
In the UK, 26% of Windows 10 users planned to keep using it without security updates, about 5.4 million people (Which?, 2025).

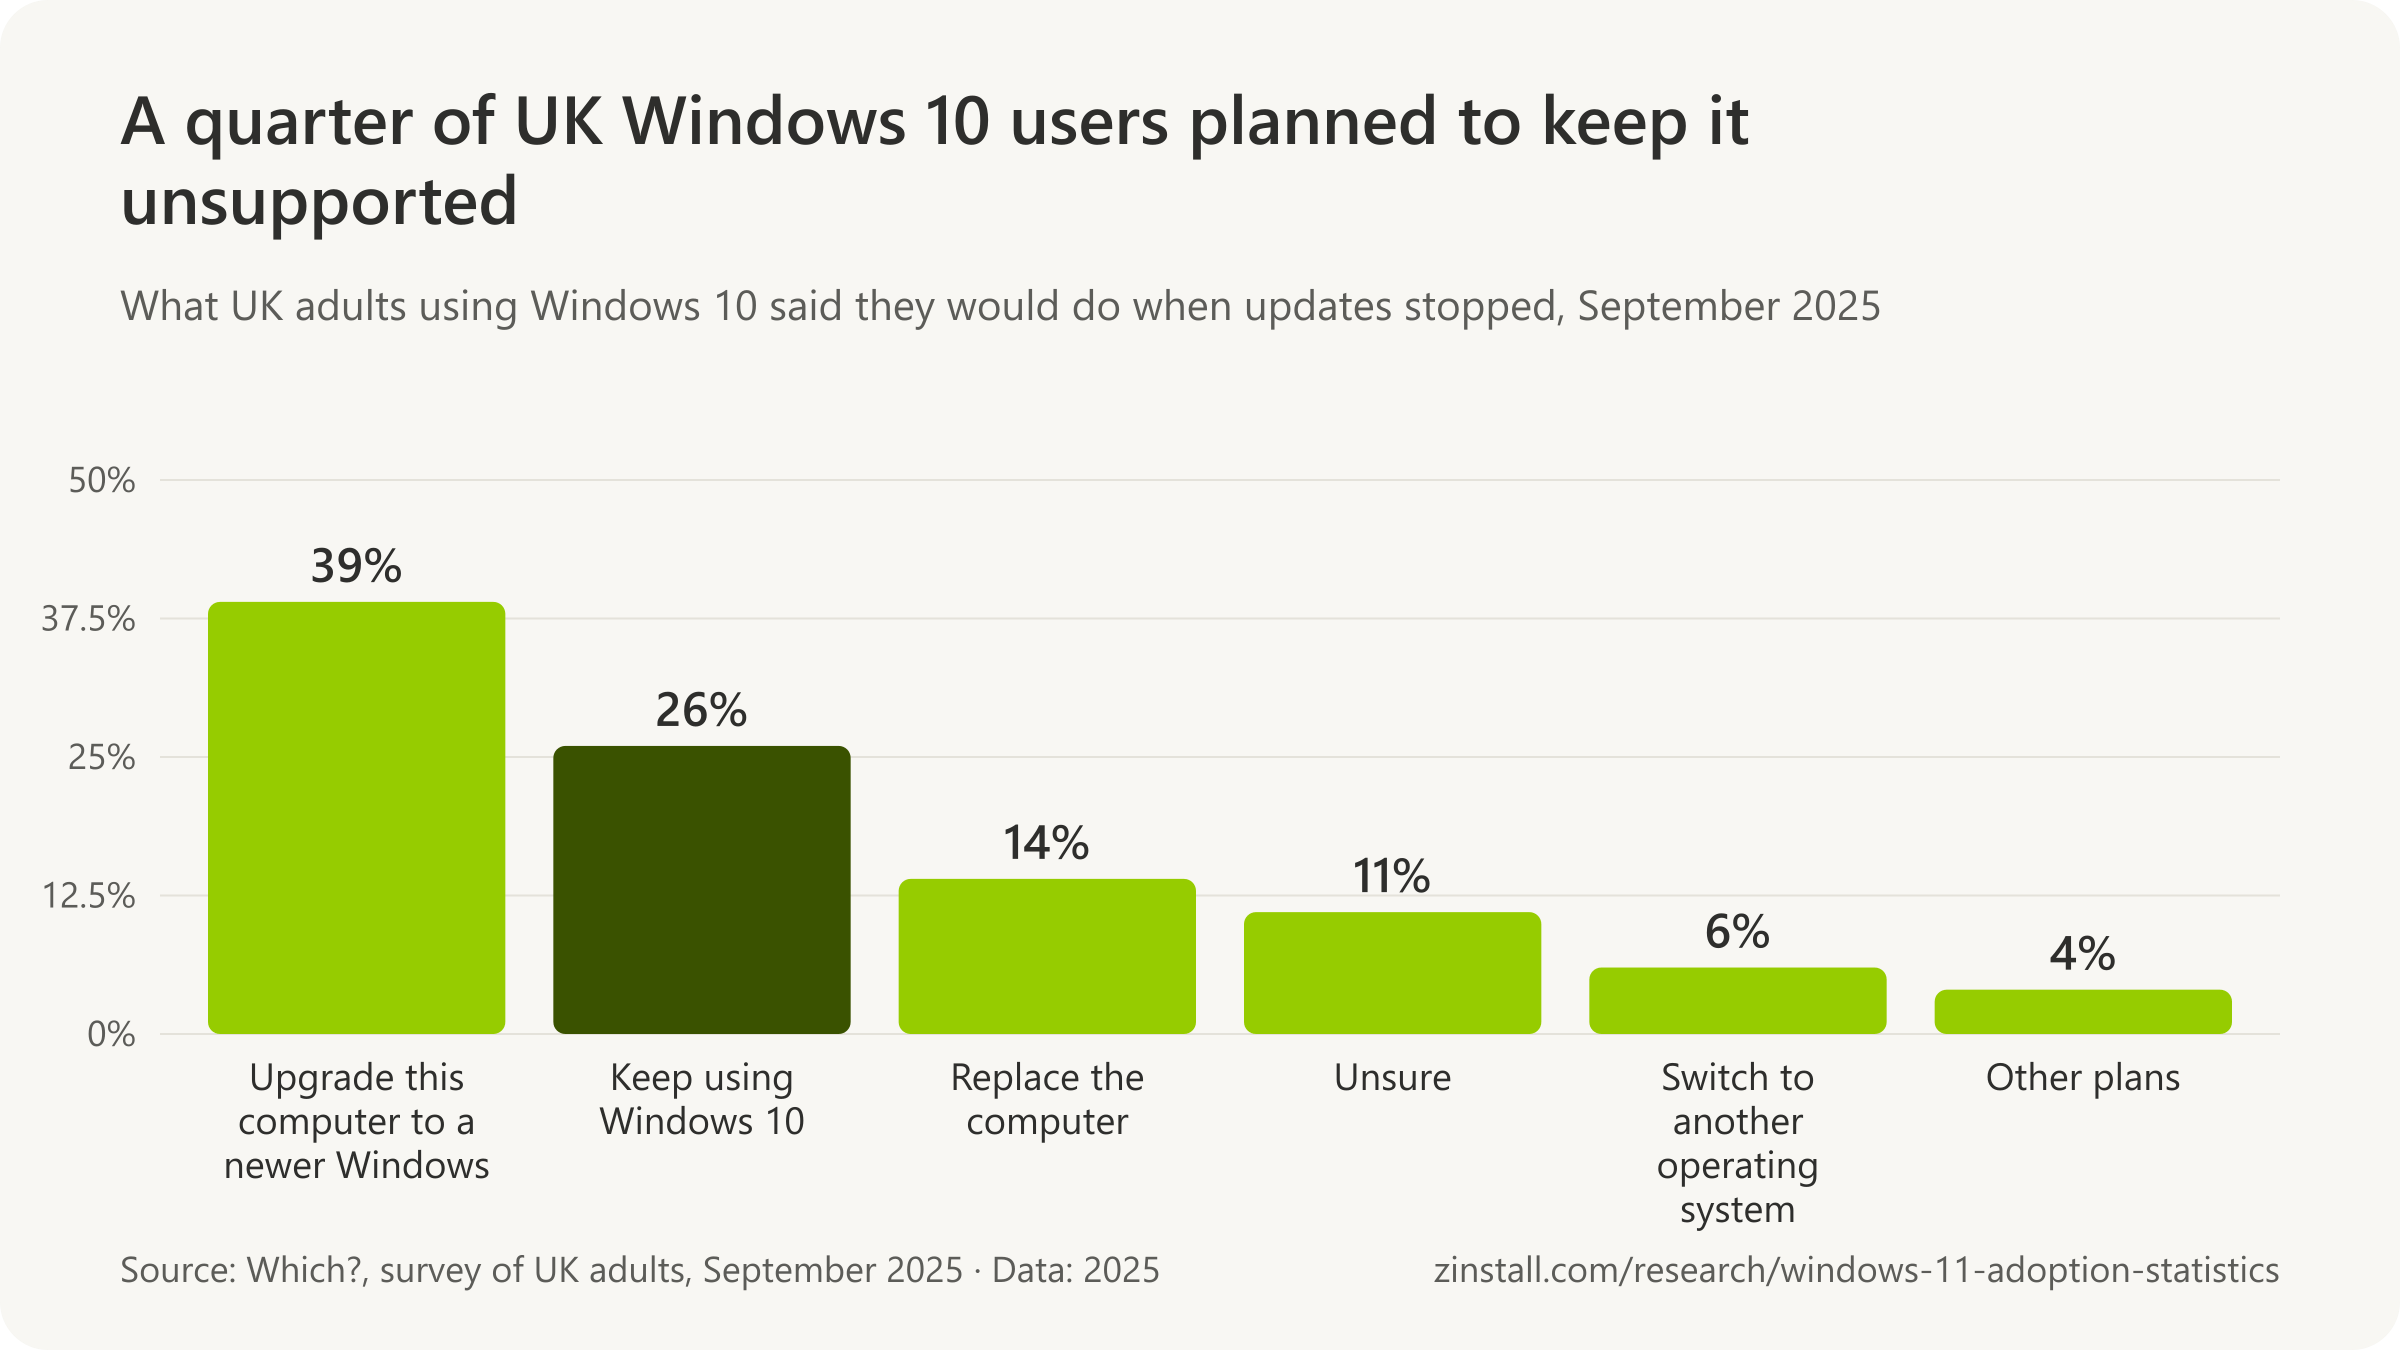
- 39% of UK Windows 10 users planned to upgrade their existing computer to a newer Windows.
- 62% of British Windows 10 users had no plan to change computer or operating system on the day support ended.
- In Germany, 34% of Windows 10 users said they would keep using it without updates, in a November 2025 survey.
- 31% of German Windows 10 users expected to need a new computer, or had already bought one, by December 2025.
- Linux reached 4.5% of desktop web traffic worldwide in September 2026, up from 3.8% a year earlier.
| Companies that | Share |
|---|---|
| Had already deployed Windows 11 | 68.1% |
| Had not yet deployed Windows 11 | 19.0% |
| Planned to keep their PCs and change only the operating system | 32.5% |
| Planned to buy new PCs | 27.5% |
| Expected Windows 10 PCs to remain in use after the end of support | 24.4% |
| Planned to have no Windows 10 PCs left by the end of support | 31.7% |
Sources: Which?; The Restart Project; Verbraucherzentrale Bundesverband (2025a, 2025b); StatCounter; Nork Research Co., Ltd.
More statistics (51)
26.0% of UK adults using Windows 10 intended to keep using it after security updates ended in October 2025, equivalent to 5.4 million people (Which?, 2025).
Surveys taken around the end-of-support date asked Windows 10 users what they would do: keep going without updates, upgrade the machine they have, buy a new one, or leave Windows altogether. A minority chose each exit, and a large minority, between a quarter and a third depending on the country, chose to do nothing. The business polls tell the same story from the supplier's side.
- 39.0% of UK adults using Windows 10 intended to upgrade their existing device to a newer version of Windows as support ended in October 2025 (Which?, 2025).
- 14.0% of UK adults using Windows 10 said they would replace their computer as support ended in October 2025 (Which?, 2025).
- 6.0% of UK adults using Windows 10 would convert to an alternative operating system such as Linux as support ended in October 2025 (Which?, 2025).
- 11.0% of UK adults using Windows 10 were unsure what they would do as support ended in October 2025 (Which?, 2025).
- 5.4 million people in the UK planned to keep using Windows 10 without security support after October 2025, 26% of an estimated 21 million Windows 10 users (Which?, 2025).
- 62% of British Windows 10 users had no plan to change computer or operating system in response to the end of support, per YouGov polling for The Restart Project in October 2025 (The Restart Project, 2025).
- 34% of Windows 10 users in Germany said they will keep using Windows 10 even when no more updates are provided (vzbv survey of 800 current or recent Windows 10 users, November 2025).
- 46% of Windows 10 users in Germany said they will switch, or had already switched, to Windows 11, in the vzbv survey of 800 current or recent Windows 10 users fielded 6 to 17 November 2025 by eye square (Verbraucherzentrale Bundesverband, 2025).
- 4% of Windows 10 users in Germany said they will switch, or had already switched, to another operating system (vzbv survey of 800 current or recent Windows 10 users, November 2025).
- 12% of Windows 10 users in Germany did not yet know how they would handle the end of Windows 10 support (vzbv survey of 800 current or recent Windows 10 users, November 2025).
- 31% of Windows 10 users in Germany expected to need a new computer because of the end of Windows 10 support, or had already bought one (vzbv survey of 800 current or recent Windows 10 users, November 2025).
- 34% of surveyed Euroconsumers members said they would keep using their device once it no longer received operating system updates, highest in Italy (39%) and lowest in Spain (30%) (Euroconsumers, 2025).
- 12% of surveyed Euroconsumers members said they would replace an unsupported Windows device even if they noticed no issues, which the organisation reads as 88% of at-risk users waiting before they act (Euroconsumers, 2025).
- 32.5% of Japanese companies surveyed in August 2025 planned to keep their existing PCs and only replace the operating system for Windows 11, against 27.5% planning to buy new PCs (Nork Research, 2025).
- 27.5% of Japanese companies surveyed in August 2025 planned to buy new PCs as part of the move to Windows 11 (Nork Research, 2025).
- 39% of 453 PC channel partners polled by Omdia said almost all of their business customers' Windows 10 PCs had been refreshed or upgraded by the October 2025 end of support (Omdia via Computerworld, 2025).
- 18% of 453 PC channel partners polled by Omdia said their customers will keep using Windows 10 past the support deadline, most likely under the Extended Security Updates programme (Omdia via Computerworld, 2025).
- 40% of 285 IT professionals surveyed by ITdaily in November 2025 said they either had a new PC or had upgraded to Windows 11, while about half were still on Windows 10 after 14 October (ITdaily, 2025).
- 19% of 285 IT professionals surveyed by ITdaily in November 2025 continued using Windows 10 without any form of support (ITdaily, 2025).
- 24% of current Windows 10 users in Germany said they will not use the Extended Security Updates programme (vzbv survey, 668 current users, November 2025).
- 10 years is the average length of free security updates that Windows 10 users in Germany said newly bought computers should receive (vzbv survey, November 2025; 562 respondents giving a number).
- 18% of Test-Achats survey respondents were directly affected by the end of Windows 10 support, owning a 2017-or-older computer that runs Windows (Test-Achats, 2025).
- 22% of consumers still used Windows 10 on PCs from 2017 or earlier that cannot be upgraded to Windows 11, as Euroconsumers restated its survey finding in its 22 September 2025 press release, there described as a survey of 3,500+ consumers (Euroconsumers, 2025).
- 15% of Consumer Reports members who owned a Windows-compatible laptop or desktop brand had owned it for at least four years, against 12% for brands not typically Windows-compatible (Consumer Reports, 2025).
- 20% of Consumer Reports members who owned a Microsoft laptop had owned it for at least four years, versus 13% for any other laptop brand, in CR's 2025 member survey (Consumer Reports, 2025).
- 48% of small, medium-sized businesses and enterprises, and 40% of very small businesses, in Kaspersky Security Network telemetry still relied on unsupported or approaching-end-of-support desktop operating systems in August 2019 (Kaspersky, 2019).
- 29% of PC channel partners polled by Omdia in June 2025 expected their PC business to grow more than 10% in the second half of 2025, with over half expecting growth, as the Windows 10 deadline approached (Omdia, 2025).
Leaving Windows
- 4.5% of desktop page views worldwide came from Linux in September 2026 (StatCounter, 2026).
- 3.8% of desktop page views worldwide came from Linux in September 2025, the month before Windows 10 end of support (StatCounter, 2025).
- 2.3% of desktop page views worldwide came from ChromeOS in September 2026, against 1.8% in September 2025 (StatCounter, 2026).
- 5.3% of desktop page views in the United States came from ChromeOS in September 2026, against 5.0% in September 2025 (StatCounter, 2026).
- 5.33% of Steam Hardware Survey participants ran Linux in March 2026, the first month above 5% in the survey's history, before the share fell back to about 3 to 4% later in 2026 (GamingOnLinux, 2026).
- 1 million downloads of Zorin OS 18 were recorded in just over a month after its 14 October 2025 release, the day Windows 10 support ended, according to the distribution's publisher (Zorin Group, 2025).
- 78% or more of the first million Zorin OS 18 downloads came from computers running Windows, according to the distribution's publisher (Zorin Group, 2025).
- About 510 places offering Linux help were listed in the End of 10 campaign's directory on 12 October 2026, across 49 country codes, with Germany (152) and France (66) the largest, by this page's count of the directory (End of 10, 2026).
- Hundreds of millions of Windows 10 devices were set to lose support because they were ineligible for Windows 11, Google said in February 2024 when it positioned ChromeOS Flex as a way to keep those PCs in use (Google, 2024).
- A ChromeOS Flex USB install kit sold through Back Market for about $3 or 3 euros was Google's April 2026 offer to owners of Windows 10 PCs left unsupported in October 2025 (Google, 2026).
- 8.8% of desktop page views worldwide were attributed to Linux in August 2026 before the share fell back to 4.5% in September 2026, a swing in StatCounter's data over the summer of 2026 (StatCounter, 2026).
- 3.7% of desktop page views in the United States came from Linux in September 2026, against 64.5% from Windows and 5.3% from ChromeOS (StatCounter, 2026).
- 4.9% of desktop page views in the United States came from Linux in September 2025, a year before the 3.7% of September 2026 (StatCounter, 2025).
- 1.8% of desktop page views worldwide came from ChromeOS in September 2025 (StatCounter, 2025).
- 2 million downloads of Zorin OS 18 were reached in under three months from its October 2025 release, with more than three quarters from Windows computers, according to Zorin Group's X post as reported by TechRepublic in January 2026 (Zorin Group via TechRepublic, 2026).
- 100 or more places and events in dozens of countries were listed on the End of 10 campaign's website at its launch on 28 May 2025, according to the campaign's announcement by KDE Eco (End of 10, 2025).
- Linux's share of Steam survey participants was 3.9% in August 2026, down 0.1 points from 4.0% in July and up 1.3 points from 2.6% in August 2025, after a March 2026 peak of 5.3% (XenoSpectrum, 2026).
- Phoronix reported Steam on Linux at 3.9% of participants in August 2026, back below 4% after July, with SteamOS 21% and CachyOS 15.4% of Linux respondents (Phoronix, 2026).
- GamingOnLinux reported the October 2025 Steam survey, the month Windows 10 support ended, as Windows 94.8% of participants (down 0.8 points), Linux 3.1% (up 0.4, its first month above 3%) and macOS 2.1% (GamingOnLinux, 2025).
- GamingOnLinux reported the July 2026 Steam survey as Windows 93.7% of participants, Linux 4.0% and macOS 2.3%, with SteamOS Holo 22.2% and CachyOS 14.3% of Linux respondents (GamingOnLinux, 2026).
- 4.4% of global desktop page views came from Linux in June 2026 per StatCounter as reported by Linuxiac (Linuxiac, 2026).
Sources: Which?; The Restart Project; Verbraucherzentrale Bundesverband (2025); Euroconsumers (2025); Nork Research Co., Ltd.; Omdia; ITdaily; Test-Achats; Consumer Reports; Kaspersky; Omdia, incorporating Canalys; StatCounter (2026); GamingOnLinux (2025, 2026); Valve; Zorin Group (2025, 2026); End of 10 campaign (2025, 2026); Google (2024, 2026); XenoSpectrum; Phoronix; Linuxiac
Windows 10 Extended Security Updates: what they cost and how long they run
Consumers can buy a year of Windows 10 security updates for $30 one time, covering up to 10 devices (Microsoft, 2026).

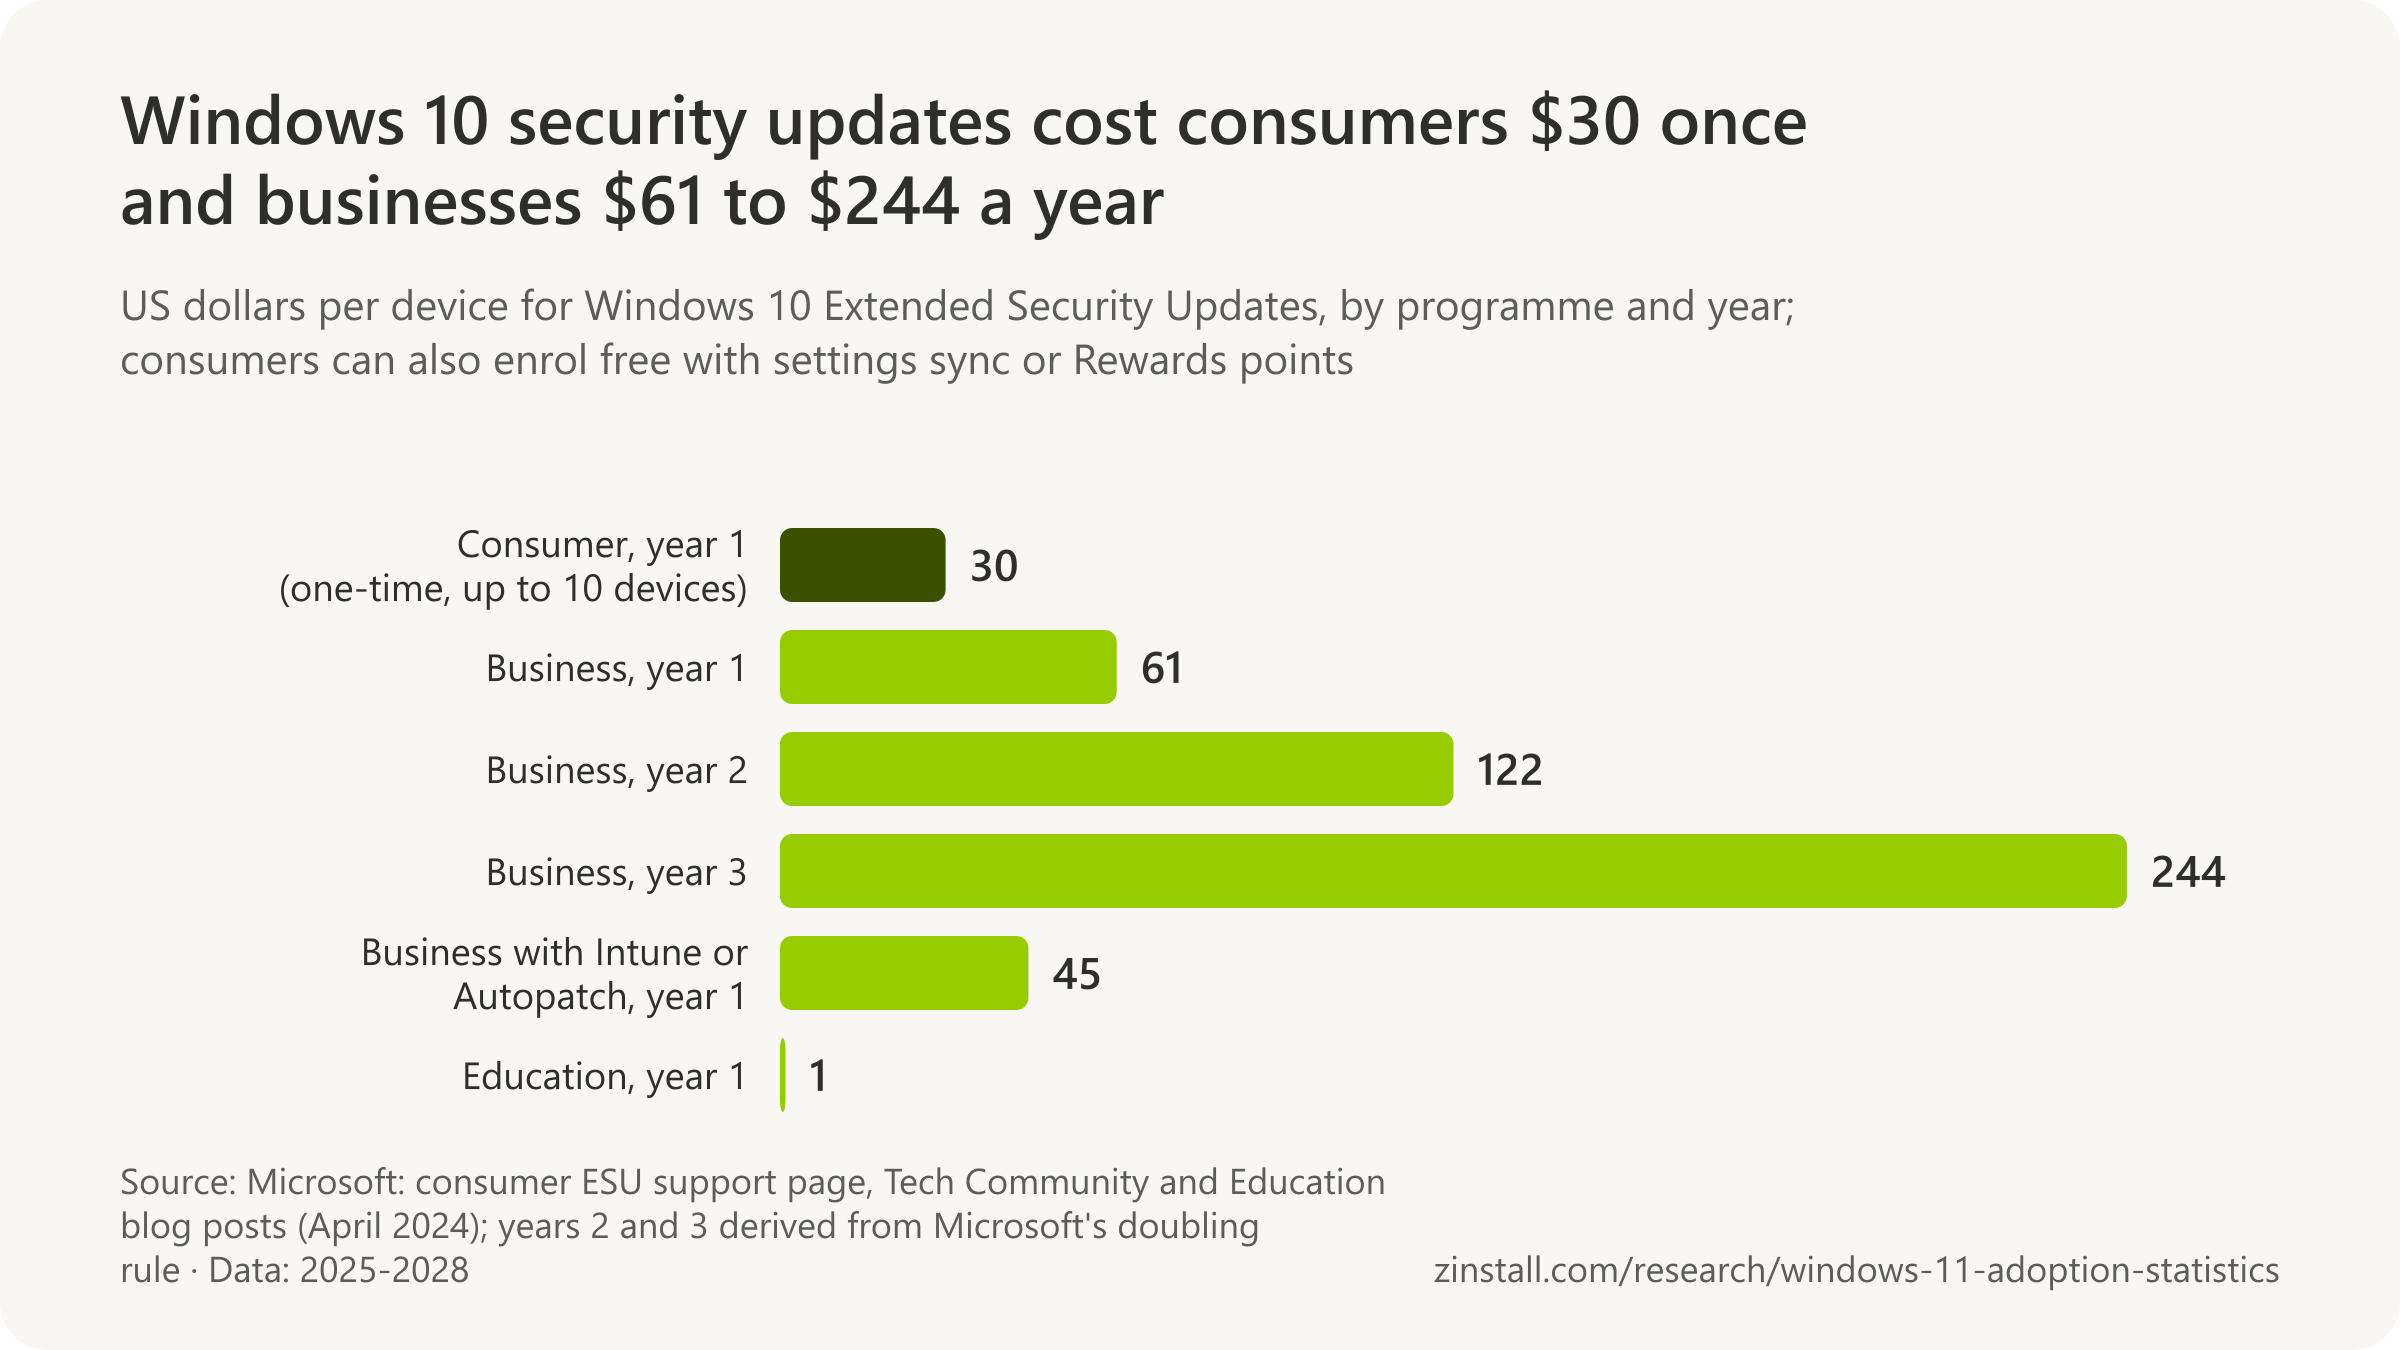
- Consumer coverage now runs to 12 October 2027, a year longer than first announced, and enrolment stays open until then.
- The updates cost $0 for consumers who sync their PC settings to a Microsoft account with Windows Backup.
- Businesses pay $61 per device for the first year of updates, through volume licensing.
- Commercial updates run for at most three years, to 10 October 2028.
- In Germany, only 14% of Windows 10 users had enrolled by mid-November 2025, and another 45% intended to.
| Programme and term | Value |
|---|---|
| Consumer ESU: free path, Microsoft Rewards points | 1,000 points |
| Consumer ESU: devices per licence (same Microsoft account) | 10 devices |
| Consumer ESU: coverage end as first announced (Year 1 of the programme) | 13 October 2026 |
| Commercial ESU: Years 2 and 3, per device (derived from Microsoft's doubling rule) | $122 / $244 |
| Commercial ESU: Year 1, per device, when managed with Intune or Windows Autopatch | $45 |
| Education ESU: Years 1, 2 and 3, per licence | $1 / $2 / $4 |
| ESU for Windows 10 in Windows 365 and Azure Virtual Desktop | $0 with Windows 365 or AVD |
| Microsoft Defender Antivirus security intelligence updates on Windows 10 | October 2028 |
Sources: Microsoft (2024, 2025, 2026); Verbraucherzentrale Bundesverband
More statistics (61)
Consumer ESU coverage for Windows 10 now runs through 12 October 2027, and already-enrolled devices continue automatically; enrolment stays open until the program ends on 12 October 2027 (Microsoft, 2026).
Microsoft sells security-only updates for Windows 10 after the end of support, on different terms for consumers, businesses, schools and cloud PCs, and it changed the consumer terms twice in the first year: once under pressure from European consumer groups and once, quietly, with an extra year. The table gives the dates and prices as Microsoft publishes them on the date this page was checked.
- Consumers can enrol a Windows 10 PC in ESU in one of three ways: at no additional cost by syncing PC settings, by redeeming 1,000 Microsoft Rewards points, or by a one-time purchase of $30 USD plus tax (Microsoft, 2026).
- The paid consumer ESU option is a one-time purchase of $30 USD (or local currency equivalent) plus applicable tax per licence, covering up to 10 devices (Microsoft, 2026).
- Consumer ESU is available at no additional cost to users who sync their PC settings to a Microsoft account with Windows Backup (Microsoft, 2026).
- Redeeming 1,000 Microsoft Rewards points is one of the two no-cash enrolment paths for consumer Windows 10 ESU (Microsoft, 2026).
- One consumer ESU licence can be used on up to 10 Windows 10 devices signed in with the same Microsoft account (Microsoft, 2026).
- Year 1 of Windows 10 ESU, the only year originally offered to consumers, runs from the 14 October 2025 end of support to 13 October 2026 in Microsoft's ESU lifecycle table (Microsoft, 2025).
- Microsoft's editor's note of 25 June 2026 on its June 2025 blog post says the consumer ESU program for personal-use devices is being provided for an additional year, with coverage through 12 October 2027 (Microsoft, 2026).
- Microsoft's statement to BleepingComputer on 25 June 2026 says the consumer ESU program is being provided for an additional year because moving to a new PC can take time, with coverage through 12 October 2027 (BleepingComputer, 2026).
- Microsoft confirmed on 25 September 2025 that consumers in the European Economic Area get Windows 10 ESU free without syncing PC settings, saying it was updating the enrolment process to meet local expectations (Windows Central, 2025).
- In the EEA a Windows 10 PC stays enrolled in free ESU only while its Microsoft account is used to sign in; after up to 60 days without sign-in, ESU updates stop until the user re-enrols (Thurrott, quoting Microsoft, 2025).
- The consumer Windows 10 ESU program delivers only critical and important security updates for Windows 10 version 22H2 devices, with no other fixes, features or technical support (Microsoft, 2026).
- Consumer ESU is not offered for kiosk-mode devices, devices joined to an Active Directory domain or Microsoft Entra, devices enrolled in MDM, or devices that already hold an ESU licence (Microsoft, 2026).
- Commercial Windows 10 ESU costs $61 USD per device for Year 1 with the traditional 5-by-5 activation key, the same as the Windows 7 ESU Year 1 price (Microsoft, 2024).
- The commercial Windows 10 ESU price doubles every consecutive year for a maximum of three years, and purchases are cumulative: joining in Year Two means paying for Year One as well (Microsoft, 2024).
- Applying Microsoft's doubling rule to the $61 USD Year 1 price gives $122 USD per device for Year 2 (14 October 2026 to 12 October 2027) and $244 USD for Year 3, $427 USD over three years (derived from Microsoft, 2024).
- Organisations managing updates with Microsoft Intune or Windows Autopatch get a cloud-managed Windows 10 ESU licence at about 25% off, $45 USD per device for Year 1, through Volume Licensing (Microsoft, 2024).
- Education customers, including K-12 and higher education, pay $1 per licence for Year 1 of Windows 10 ESU, $2 for Year 2 and $4 for Year 3 (Microsoft, 2024).
- Windows 10 Cloud PCs in Windows 365 and virtual machines in Azure Virtual Desktop are automatically entitled to ESU at no additional charge, and Windows 10 devices accessing Windows 11 Cloud PCs through Windows 365 are activated for ESU without extra steps (Microsoft, 2024).
- Windows 10 ESU runs for a maximum of three years after the 14 October 2025 end of support: Year 1 to 13 October 2026, Year 2 to 12 October 2027 and Year 3 to 10 October 2028 (Microsoft, 2025).
- Technical support is not included in Windows 10 ESU; support is limited to ESU licence activation, installation of the monthly ESU updates and regressions caused by them (Microsoft, 2025).
- Microsoft states that a Windows 10 computer will not stop working after the 14 October 2025 end of support, but will no longer receive security updates (Microsoft, 2025).
- Microsoft Defender Antivirus on Windows 10 keeps receiving Security Intelligence Updates through October 2028, three years past end of support (Microsoft, 2025).
- Microsoft 365 Apps on Windows 10 keep receiving security updates for three years after Windows 10's end of support, until 10 October 2028 (Microsoft, 2026).
- Microsoft Edge and the WebView2 Runtime continue to receive updates on Windows 10 22H2 until at least October 2028, and ESU enrolment is not required for them (Microsoft, 2026).
- 14% of current Windows 10 users in Germany had already enrolled in Microsoft's Extended Security Updates programme by mid-November 2025 (vzbv survey of 668 current users, 2025).
- 45% of current Windows 10 users in Germany had not yet enrolled in the Extended Security Updates programme but intended to (vzbv survey, 668 current users, November 2025).
- 31% of 285 IT professionals surveyed by ITdaily in November 2025 had signed up for Windows 10 Extended Security Updates, 29% on the free one-year consumer option and only 2% on the paid three-year commercial option (ITdaily, 2025).
- Microsoft first announced a consumer ESU option for Windows 10 on 31 October 2024, as a one-year option for $30 USD, the first time a Windows ESU was offered for personal use (Microsoft, 2024).
- Consumer ESU coverage for personal Windows 10 devices starts on 15 October 2025, the day after end of support; the enrolment wizard rolled out from July 2025 with broad availability by mid-August 2025 (Microsoft, 2025).
- Consumer ESU requires Windows 10 version 22H2 (Home, Professional, Pro Education or Workstations), the latest update, the ESU Licensing Preparation Package KB5126256, and an administrator Microsoft account (Microsoft, 2026).
- Microsoft's consumer ESU page states that enrolment options and timing may vary by region, naming the European Economic Area, while updates are applied consistently across all supported areas (Microsoft, 2026).
- Euroconsumers' press release of 22 September 2025 gives the original consumer ESU end date as 13 October 2026, when it announced Microsoft's free EEA option (Euroconsumers, 2025).
- Euroconsumers announced on 22 September 2025 that the free EEA ESU year does not require Microsoft Rewards, OneDrive or other tied services, after more than two years of advocacy under the Digital Markets Act (Euroconsumers, 2025).
- Petri's 26 September 2025 report restates the original consumer ESU terms: coverage until 13 October 2026 for a one-time $30 fee, with free options added in June 2025 (Petri, 2025).
- Microsoft's end-of-support page says the consumer ESU program can protect a Windows 10 device until 12 October 2027 (Microsoft, 2026).
- BleepingComputer's 25 June 2026 report gives the original consumer ESU expiry as 12 October 2026, one day earlier than the 13 October 2026 in Microsoft's lifecycle table (BleepingComputer, 2026).
- Help Net Security's 26 June 2026 report says the consumer ESU program, originally set to end on 13 October 2026, now runs to 12 October 2027, announced only via documentation edits and an editor's note (Help Net Security, 2026).
- Petri's 4 April 2024 report prints the Year 2 and Year 3 commercial ESU prices as $122 and $244 per device, figures Microsoft's post implies through its doubling rule but does not print (Petri, 2024).
- ZDNet's guide, last updated 9 July 2025, adds the three commercial ESU years to $427 per PC, noting Microsoft's post does not do that arithmetic (ZDNet, 2025).
- Computerworld's 4 April 2024 report restates the Intune and Windows Autopatch discount as 25% off, $45 per device for the first year, for up to five devices (Computerworld, 2024).
- Windows 10 endpoints connecting to Windows 365 Cloud PCs are entitled to ESU for up to three years with an active Windows 365 subscription licence, and ESU is free for Windows 10 virtual machines in Azure services (Microsoft, 2025).
- The editions that qualify for commercial Windows 10 ESU are Enterprise, Education and Pro in commercial use; LTSB and LTSC releases have their own lifecycles and are not covered by the Windows 10 ESU program (Microsoft, 2025).
- Commercial Windows 10 ESU must be bought by whole year (no partial periods), the minimum purchase is one licence, and the page dates Year One from November 2025, when the first ESU update shipped (Microsoft, 2025).
- Commercial ESU is activated per device with a Multiple Activation Key from the Microsoft 365 admin center, installed with slmgr.vbs /ipk and activated against a separate activation ID for ESU Year 1, Year 2 and Year 3 (Microsoft, 2026).
- Commercial Windows 10 ESU licences went on sale through Volume Licensing from October to November 2024, a year before end of support, and through Cloud Solution Provider partners from 1 September 2025 (Microsoft, 2024).
- Extended Security Updates for Windows 10 Enterprise LTSB 2016 became purchasable on 1 April 2026 through Volume Licensing or a Cloud Solution Provider, for up to three years after its 13 October 2026 end of support (Microsoft Message Center MC1274396, 2026).
- Windows Central reported on 24 February 2026 that the Windows 10 Enterprise 2016 LTSB ESU would cost $61 per device for the first year, $45 for Intune or Autopatch managed PCs, doubling each year for up to three years (Windows Central, 2026).
- After 14 October 2025 Microsoft provides no technical support, software updates or security fixes for Windows 10, and says unpatched PCs are at greater risk from viruses and malware (Microsoft, 2025).
- Microsoft's statement after end of support, quoted by TechRadar on 15 October 2025, says security intelligence updates for the built-in Defender Antivirus continue through October 2028 for Windows 10 customers without Defender for Endpoint (TechRadar, 2025).
- Microsoft 365 Apps on Windows 10 stop receiving feature updates at Version 2608, the August 2026 build, and then receive only security updates until 10 October 2028 (Microsoft, 2026).
- Support for Office 2016 and Office 2019 ended on 14 October 2025 on all operating systems, the day Windows 10 support ended, and support for Office 2021 and Office LTSC 2021 was to end a year later, in October 2026 (Microsoft, 2026).
- As of 12 October 2026, 363 days have passed since Windows 10 reached end of support on 14 October 2025 (derived from Microsoft's lifecycle date, 2026).
- The first anniversary of Windows 10 end of support falls on 14 October 2026, one day after the originally announced consumer ESU end date of 13 October 2026 and a year before the extended consumer ESU end of 12 October 2027 (derived from Microsoft dates, 2026).
- Windows 10 was supported for 3,730 days, about 10.2 years, from its 29 July 2015 release to its 14 October 2025 end of support (Microsoft lifecycle dates, 2025).
- 24% of current Windows 10 users in Germany said they will not use the Extended Security Updates programme (vzbv survey, 668 current users, November 2025).
| Programme and term | Value | Scope |
|---|---|---|
| Consumer ESU: paid option, one-time, up to 10 devices | $30 | Windows 10 consumer ESU licences · Worldwide · 2025-10-15/2027-10-12 |
| Consumer ESU: free path, settings sync with Windows Backup | $0 with settings sync | Windows 10 consumer ESU enrolments · Worldwide · 2025-10-15/2027-10-12 |
| Consumer ESU: free path, Microsoft Rewards points | 1,000 points | Windows 10 consumer ESU enrolments · Worldwide · 2025-10-15/2027-10-12 |
| Consumer ESU: devices per licence (same Microsoft account) | 10 devices | Windows 10 consumer ESU licences · Worldwide · 2025-10-15/2027-10-12 |
| Consumer ESU: coverage end as first announced (Year 1 of the programme) | 13 October 2026 | Windows 10 ESU, Year 1 · Worldwide · 2025-10-15/2026-10-13 |
| Consumer ESU: coverage end after the June 2026 extension | 12 October 2027 | Windows 10 consumer ESU · Worldwide · 2025-10-15/2027-10-12 |
| Commercial ESU: Year 1, per device (volume licensing) | $61 | Windows 10 commercial ESU licences (Enterprise, Education and Pro in commercial use) · Worldwide · 2025-10-15/2026-10-13 |
| Commercial ESU: Years 2 and 3, per device (derived from Microsoft's doubling rule) | $122 / $244 | Windows 10 commercial ESU licences · Worldwide · 2026-10-14/2028-10-10 |
| Commercial ESU: Year 1, per device, when managed with Intune or Windows Autopatch | $45 | Windows 10 commercial ESU licences for devices managed with Microsoft Intune or Windows Autopatch · Worldwide · 2025-10-15/2026-10-13 |
| Education ESU: Years 1, 2 and 3, per licence | $1 / $2 / $4 | Windows 10 ESU licences for education customers (K-12 and higher education) · Worldwide · 2025-10-15/2028-10-10 |
| ESU for Windows 10 in Windows 365 and Azure Virtual Desktop | $0 with Windows 365 or AVD | Windows 10 Cloud PCs, AVD virtual machines, and Windows 10 endpoints accessing Windows 365 Cloud PCs · Worldwide · 2025-10-15/2028-10-10 |
| Commercial ESU: end of Year 3 (last day of the programme) | 10 October 2028 | Windows 10 ESU, commercial and education · Worldwide · 2025-10-15/2028-10-10 |
| Microsoft Defender Antivirus security intelligence updates on Windows 10 | October 2028 | Windows 10 PCs with Microsoft Defender Antivirus · Worldwide · 2028-10 |
| Microsoft 365 Apps on Windows 10: security updates end | 10 October 2028 | Microsoft 365 Apps (including Project and Visio subscription apps) on Windows 10 · Worldwide · 2028-10-10 |
| Microsoft Edge and WebView2 on Windows 10 22H2 | at least October 2028 | Microsoft Edge and WebView2 Runtime on Windows 10 version 22H2 · Worldwide · 2028-10 |
| Windows 10 Enterprise 2016 LTSB: end of extended support | 13 October 2026 | Windows 10 Enterprise 2016 LTSB · Worldwide · 2026-10-13 |
| Windows 10 Enterprise LTSC 2021: end of support | 12 January 2027 | Windows 10 Enterprise LTSC 2021 · Worldwide · 2027-01-12 |
| Windows 10 Enterprise LTSC 2019: end of extended support | 9 January 2029 | Windows 10 Enterprise LTSC 2019 · Worldwide · 2029-01-09 |
| Windows 10 IoT Enterprise LTSC 2021: end of extended support | 13 January 2032 | Windows 10 IoT Enterprise LTSC 2021 · Worldwide · 2032-01-13 |
- Microsoft has published no count of Windows 10 devices enrolled in ESU: neither its ESU pages nor its 25 June 2026 statement on the extension gives an enrolment figure (Microsoft statement via BleepingComputer, 2026).
Sources: Microsoft (2024, 2025, 2026); BleepingComputer; Windows Central (2025, 2026); Thurrott; Verbraucherzentrale Bundesverband; ITdaily; Euroconsumers; Petri (2024, 2025); Help Net Security; ZDNet; Computerworld; TechRadar
How many people still use Windows 7?
Windows 7 was down to 0.55% of Windows desktop web traffic worldwide in September 2026, six years after its support ended (StatCounter, 2026).

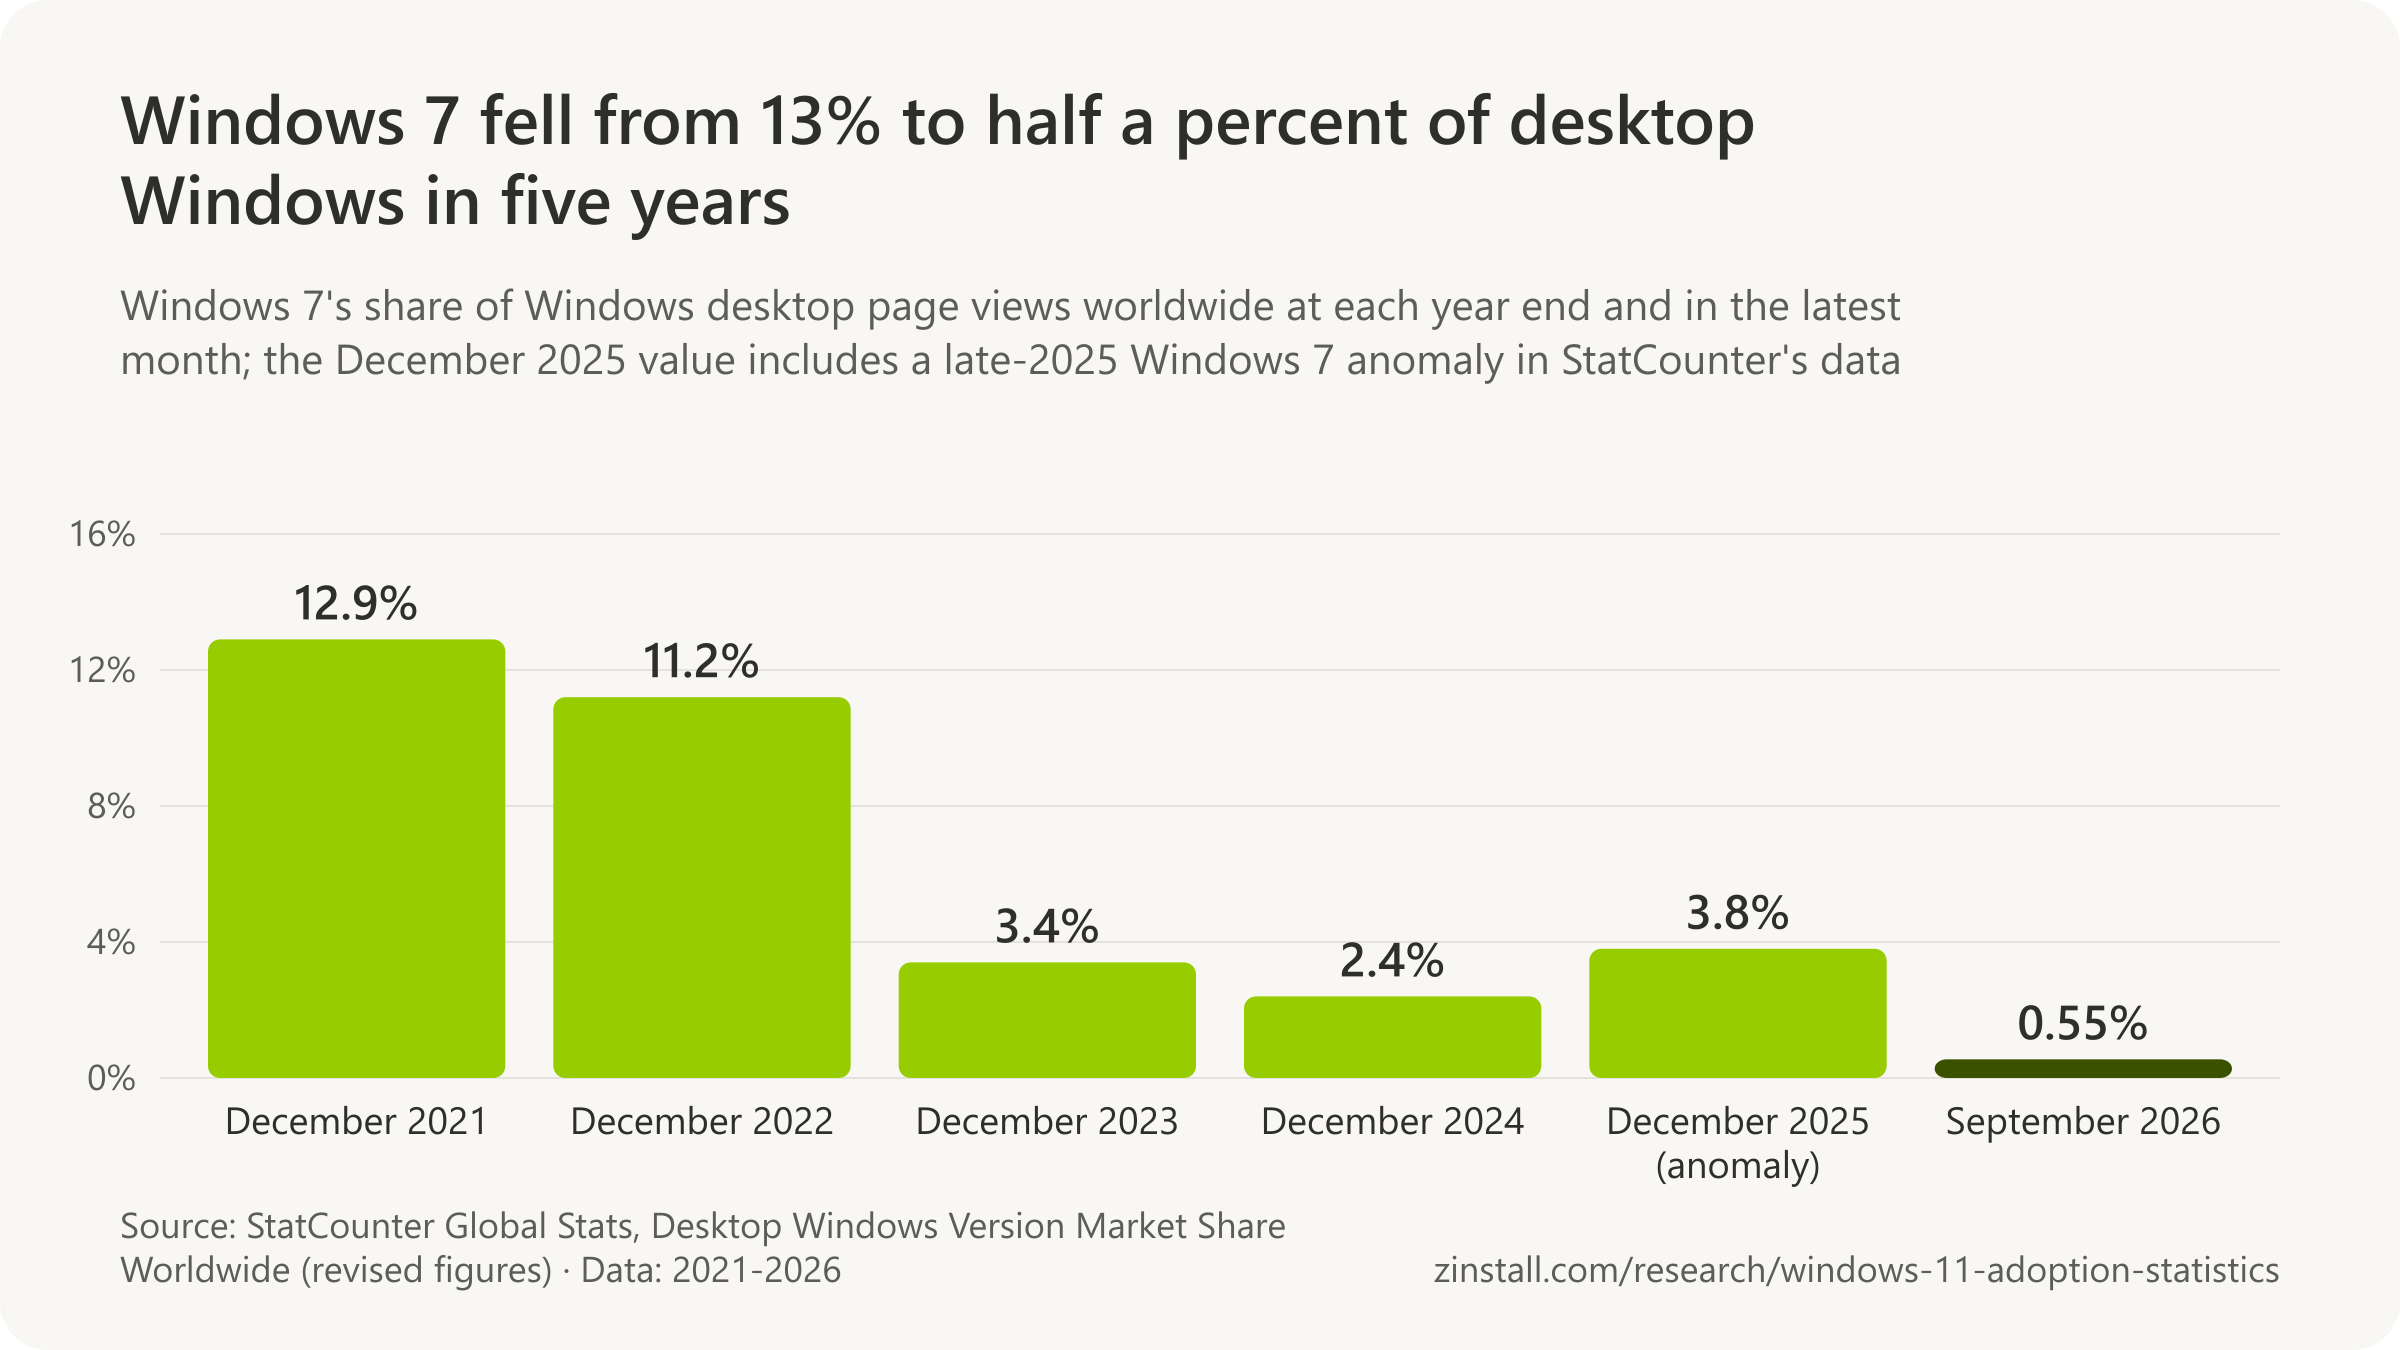
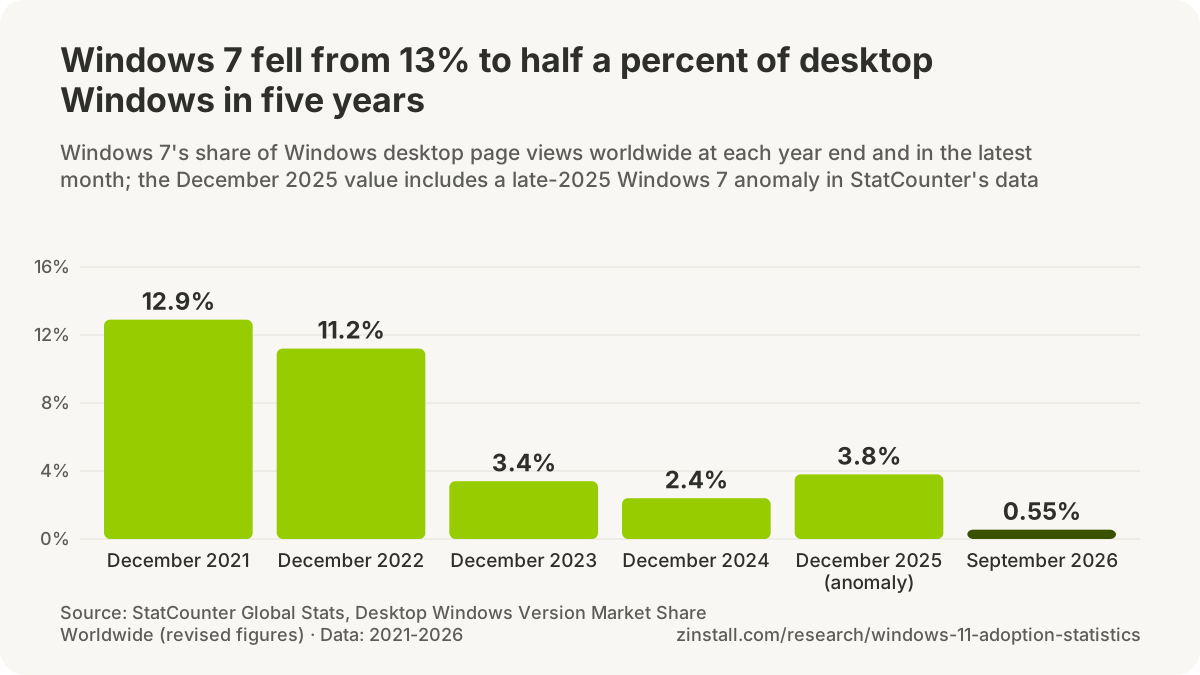
- Windows 7, 8, 8.1 and XP together were 0.7% of Windows desktop web traffic in September 2026.
- Security telemetry still found Windows 7 on 8.5% of devices in September 2025, more than five years after its end of support.
- About 565,000 PCs in German homes still ran Windows 7 in January 2026.
- Windows XP was down to 0.05% of Windows desktop web traffic worldwide in September 2026.
- In China, Windows 7's share of desktop web traffic fell from 19.2% to 4.3% during 2025.
| Country | Windows 7 share |
|---|---|
| China | 4.5% |
| Sudan | 1.8% |
| Russia | 1.8% |
| Belarus | 1.8% |
| Spain | 1.6% |
| Japan | 1.0% |
| Egypt | 0.9% |
Sources: StatCounter (2022, 2026); Kaspersky; ESET Deutschland GmbH; StatCounter Global Stats (2026a, 2026b, 2026c, 2026d)
More statistics (76)
0.55% of Windows desktop page views worldwide came from Windows 7 in September 2026 (StatCounter, 2026).
Each retired Windows version leaves a long tail that shrinks for a decade. The shares below are small worldwide but not everywhere, and the lifecycle table gives the date each version lost its support, including the Windows 10 editions that keep it for years yet.
- 0.09% of Windows desktop page views worldwide came from Windows 8.1 in September 2026 (StatCounter, 2026).
- 0.05% of Windows desktop page views worldwide came from Windows XP in September 2026 (StatCounter, 2026).
- 0.02% of Windows desktop page views worldwide came from Windows 8 in September 2026 (StatCounter, 2026).
- 0.7% of Windows desktop page views worldwide came from Windows 7, 8, 8.1 or XP together in September 2026 (StatCounter, 2026).
- 4.5% of Windows desktop page views in China came from Windows 7 in September 2026, the highest Windows 7 share of the 44 countries checked (StatCounter, 2026).
- 1.8% of Windows desktop page views in Russia still came from Windows 7 in September 2026 (StatCounter, 2026).
- 1.6% of Windows desktop page views in Spain still came from Windows 7 in September 2026 (StatCounter, 2026).
- 1.0% of Windows desktop page views in Japan still came from Windows 7 in September 2026 (StatCounter, 2026).
- 0.9% of Windows desktop page views in Egypt still came from Windows 7 in September 2026 (StatCounter, 2026).
- 11.2% of Windows desktop page views worldwide came from Windows 7 in December 2022 (StatCounter, 2026).
- 3.4% of Windows desktop page views worldwide came from Windows 7 in December 2023 (StatCounter, 2026).
- 2.4% of Windows desktop page views worldwide came from Windows 7 in December 2024 (StatCounter, 2026).
- About 840,000 PCs in German private households still ran Windows 8.1, 8, 7 or XP in January 2026, about 20% fewer than in August 2025 (ESET, 2026).
- About 565,000 PCs in German private households still ran Windows 7 in January 2026 (ESET, 2026).
- 8.5% of devices in Kaspersky Security Network telemetry still ran Windows 7 in September 2025, more than five years after its support ended (Kaspersky, 2025).
- Windows 7 no longer appears as a listed operating system in the September 2026 Steam survey, where all Windows versions other than 11 and 10 together account for about 0.1% of participants (Valve Steam Hardware and Software Survey, 2026).
- 42.8% of Windows users worldwide were on Windows 10 in September 2025, PIRG wrote, against 3.7% still on Windows 8 when its support ended in January 2016 and 2.2% on 8.1 in January 2023 (PIRG, 2025).
- 13.6% of Windows desktop page views worldwide came from Windows 7 in October 2021, when Windows 11 launched (StatCounter, 2026).
- 12.9% of Windows desktop page views worldwide came from Windows 7 in December 2021, almost two years after its end of support (StatCounter, 2026).
- 2.60% of Windows desktop page views worldwide came from Windows 8.1 in December 2022 (StatCounter, 2026).
- 0.49% of Windows desktop page views worldwide came from Windows XP in December 2022 (StatCounter, 2026).
- 1.68% of Windows desktop page views worldwide came from Windows 8.1 in December 2023 (StatCounter, 2026).
- 0.64% of Windows desktop page views worldwide came from Windows XP in December 2023 (StatCounter, 2026).
- 0.30% of Windows desktop page views worldwide came from Windows 8.1 in December 2024 (StatCounter, 2026).
- 0.24% of Windows desktop page views worldwide came from Windows XP in December 2024 (StatCounter, 2026).
- 0.15% of Windows desktop page views worldwide came from Windows 8.1 in December 2025 (StatCounter, 2026).
- 0.43% of Windows desktop page views worldwide came from Windows XP in December 2025 (StatCounter, 2026).
- 19.2% of Windows desktop page views in China came from Windows 7 in December 2024 (StatCounter, 2026).
- 4.3% of Windows desktop page views in China came from Windows 7 in December 2025, down from 19.2% a year earlier (StatCounter, 2026).
- 12.0% of Windows desktop page views in China were attributed to Windows 7 in StatCounter's running July 2025 data as reported by Gigazine (Gigazine, 2025).
- 1.8% of Windows desktop page views in Sudan came from Windows 7 in September 2026 (StatCounter, 2026).
- 1.8% of Windows desktop page views in Belarus came from Windows 7 in September 2026 (StatCounter, 2026).
- Over 1 million PCs in Germany still ran Windows 8.1, 8, 7 or XP at the start of 2025 (ESET, 2025).
- About 175,000 PCs in German private households still ran Windows 8.1 in January 2026 (ESET, 2026).
- About 55,000 PCs in German private households still ran Windows XP in January 2026 (ESET, 2026).
- About 45,000 PCs in German private households still ran Windows 8 in January 2026 (ESET, 2026).
- 0.06% of Steam survey participants ran Windows 7 (64-bit) in August 2026, the last month Valve listed it before it dropped off the September 2026 page (Valve Steam Hardware and Software Survey, 2026).
| Month | Windows 7 share | Scope |
|---|---|---|
| December 2021 | 12.9% | Windows desktop devices (desktops and laptops) in StatCounter's page-view sample · Worldwide · 2021-12 |
| December 2022 | 11.2% | Windows desktop devices (desktops and laptops) in StatCounter's page-view sample · Worldwide · 2022-12 |
| December 2023 | 3.4% | Windows desktop devices (desktops and laptops) in StatCounter's page-view sample · Worldwide · 2023-12 |
| December 2024 | 2.4% | Windows desktop devices (desktops and laptops) in StatCounter's page-view sample · Worldwide · 2024-12 |
| December 2025 (anomaly) | 3.8% | Windows desktop devices (desktops and laptops) in StatCounter's page-view sample · Worldwide · 2025-12 |
| September 2026 (latest) | 0.55% | Windows desktop devices (desktops and laptops) in StatCounter's page-view sample · Worldwide · 2026-09 |

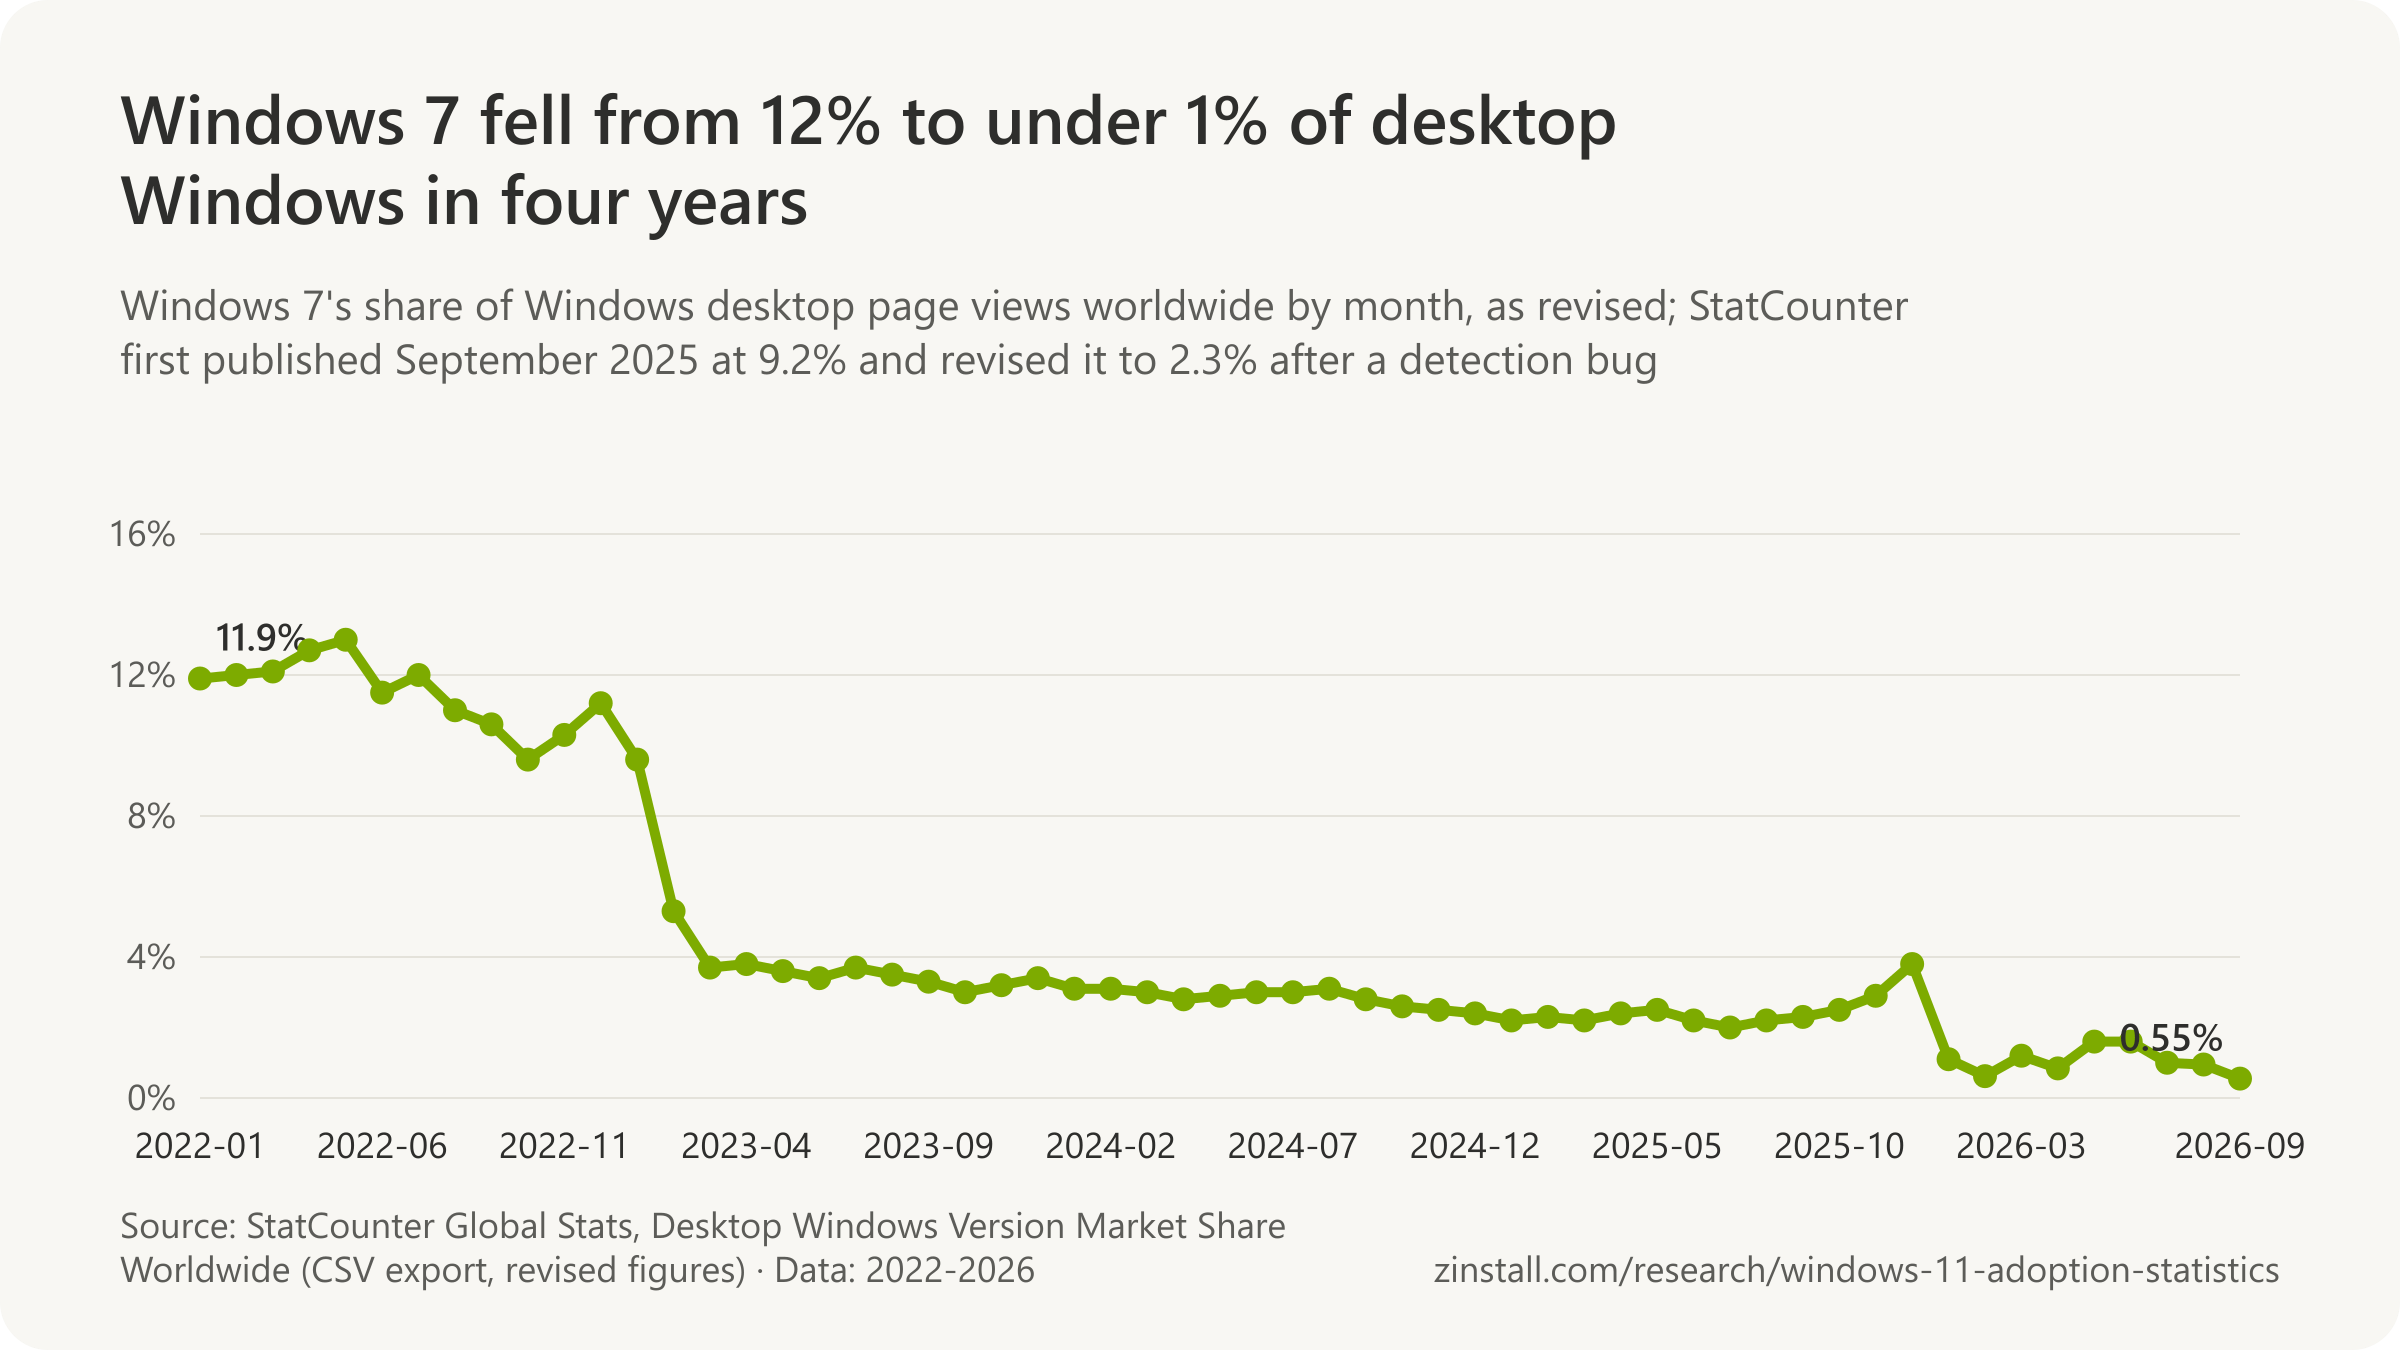
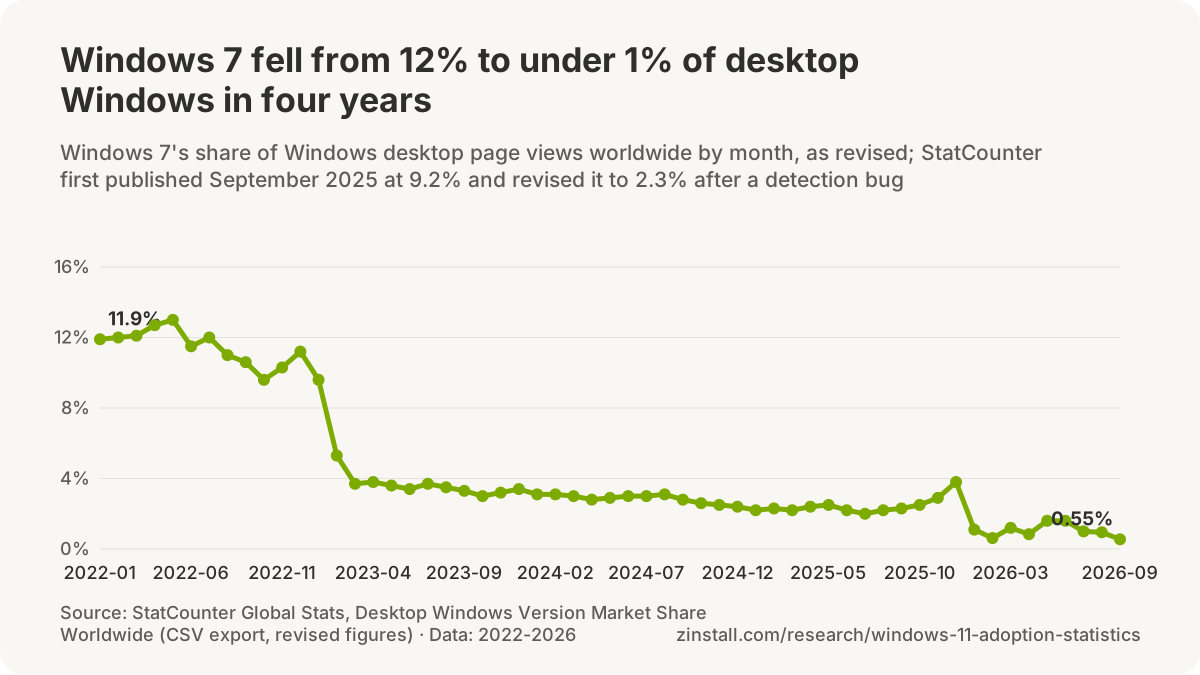
| Version | End of support | Scope |
|---|---|---|
| Windows XP | 8 April 2014 | Windows XP, all editions · Worldwide · 2014-04-08 |
| Windows 8 | 12 January 2016 | Windows 8, all editions · Worldwide · 2016-01-12 |
| Windows Vista | 11 April 2017 | Windows Vista, all editions · Worldwide · 2017-04-11 |
| Windows 7 | 14 January 2020 | Windows 7, all editions · Worldwide · 2020-01-14 |
| Windows 7 (paid ESU, final year) | 10 January 2023 | Windows 7 Professional, Enterprise and Professional for Embedded Systems with ESU · Worldwide · 2023-01-10 |
| Windows 8.1 | 10 January 2023 | Windows 8.1, all editions · Worldwide · 2023-01-10 |
| Windows 10 Home and Pro (version 22H2) | 14 October 2025 | Windows 10 Home, Pro, Pro Education, Pro for Workstations · Worldwide · 2025-10-14 |
| Windows 10 Enterprise 2016 LTSB: end of extended support | 13 October 2026 | Windows 10 Enterprise 2016 LTSB · Worldwide · 2026-10-13 |
| 24H2, Home and Pro | 13 October 2026 | Windows 11 Home, Pro, Pro Education, Pro for Workstations, version 24H2 · Worldwide · 2026-10-13 |
| Windows 10 Enterprise LTSC 2021: end of support | 12 January 2027 | Windows 10 Enterprise LTSC 2021 · Worldwide · 2027-01-12 |
| 25H2, Home and Pro | 12 October 2027 | Windows 11 Home, Pro, Pro Education, Pro for Workstations, version 25H2 · Worldwide · 2027-10-12 |
| Windows 10 Enterprise LTSC 2019: end of extended support | 9 January 2029 | Windows 10 Enterprise LTSC 2019 · Worldwide · 2029-01-09 |
| Windows 11 Enterprise LTSC 2024: end of mainstream support | 9 October 2029 | Windows 11 Enterprise LTSC 2024 · Worldwide · 2029-10-09 |
| Windows 10 IoT Enterprise LTSC 2021: end of extended support | 13 January 2032 | Windows 10 IoT Enterprise LTSC 2021 · Worldwide · 2032-01-13 |
Windows 11 versions and their own end dates
- Windows 10 was released on 29 July 2015, the start date Microsoft's lifecycle listing gives for Windows 10 Home and Pro (Microsoft, 2015).
- Windows 10 version 22H2, the last Windows 10 feature update, became available on 18 October 2022 and was serviced until 14 October 2025 (Microsoft, 2025).
- Windows 10 Enterprise and Education (version 22H2) also reached end of support on 14 October 2025, while LTSC releases keep their own lifecycles (Microsoft, 2025).
- Windows 10 Enterprise 2015 LTSB reached the end of extended support on 14 October 2025, the same day as Windows 10 22H2 (Microsoft, 2025).
- Windows 10 IoT Enterprise LTSC 2019 reaches the end of extended support on 9 January 2029 (Microsoft, 2026).
- Windows 11 Home and Pro has a lifecycle start date of 4 October 2021 (version 21H2); the public release was announced for 5 October 2021 (Microsoft, 2021).
- Windows 11 IoT Enterprise LTSC 2024 has mainstream support to 9 October 2029 and extended support to 10 October 2034 (Microsoft, 2026).
| Version and editions | End of servicing | Scope |
|---|---|---|
| 21H2, Home and Pro | 10 October 2023 | Windows 11 Home, Pro, Pro Education, Pro for Workstations, version 21H2 · Worldwide · 2023-10-10 |
| 21H2, Enterprise and Education | 8 October 2024 | Windows 11 Enterprise, Education, Enterprise multi-session, version 21H2 · Worldwide · 2024-10-08 |
| 22H2, Home and Pro | 8 October 2024 | Windows 11 Home, Pro, Pro Education, Pro for Workstations, version 22H2 · Worldwide · 2024-10-08 |
| 22H2, Enterprise and Education | 14 October 2025 | Windows 11 Enterprise, Education, Enterprise multi-session, version 22H2 · Worldwide · 2025-10-14 |
| 23H2, Home and Pro | 11 November 2025 | Windows 11 Home, Pro, Pro Education, Pro for Workstations, version 23H2 · Worldwide · 2025-11-11 |
| 23H2, Enterprise and Education | 10 November 2026 | Windows 11 Enterprise, Education, Enterprise multi-session, version 23H2 · Worldwide · 2026-11-10 |
| 24H2, Home and Pro | 13 October 2026 | Windows 11 Home, Pro, Pro Education, Pro for Workstations, version 24H2 · Worldwide · 2026-10-13 |
| 24H2, Enterprise and Education | 12 October 2027 | Windows 11 Enterprise, Education, Enterprise multi-session, version 24H2 · Worldwide · 2027-10-12 |
| 25H2, Home and Pro | 12 October 2027 | Windows 11 Home, Pro, Pro Education, Pro for Workstations, version 25H2 · Worldwide · 2027-10-12 |
| 25H2, Enterprise and Education | 10 October 2028 | Windows 11 Enterprise, Education, Enterprise multi-session, version 25H2 · Worldwide · 2028-10-10 |
| 26H1, Home and Pro | 14 March 2028 | Windows 11 Home, Pro, Pro Education, Pro for Workstations, version 26H1 · Worldwide · 2028-03-14 |
| 26H1, Enterprise and Education | 13 March 2029 | Windows 11 Enterprise, Education, Enterprise multi-session, version 26H1 · Worldwide · 2029-03-13 |
| 26H2, Home and Pro | 9 October 2028 | Windows 11 Home, Pro, Pro Education, Pro for Workstations, version 26H2 · Worldwide · 2028-10-09 |
| 26H2, Enterprise and Education | 9 October 2029 | Windows 11 Enterprise, Education, Enterprise multi-session, version 26H2 · Worldwide · 2029-10-09 |
Sources: StatCounter (2023, 2025, 2026); StatCounter Global Stats (2026); ESET Deutschland GmbH (2025, 2026); Kaspersky; Valve; U.S. PIRG; Gigazine; The Register; Microsoft (2014-2026); Guru3D
Do old programs run on Windows 11?
77% of surveyed UK and US CIOs had at least one application that would not run on the latest Windows, in June 2022 (Cloudhouse, 2022).

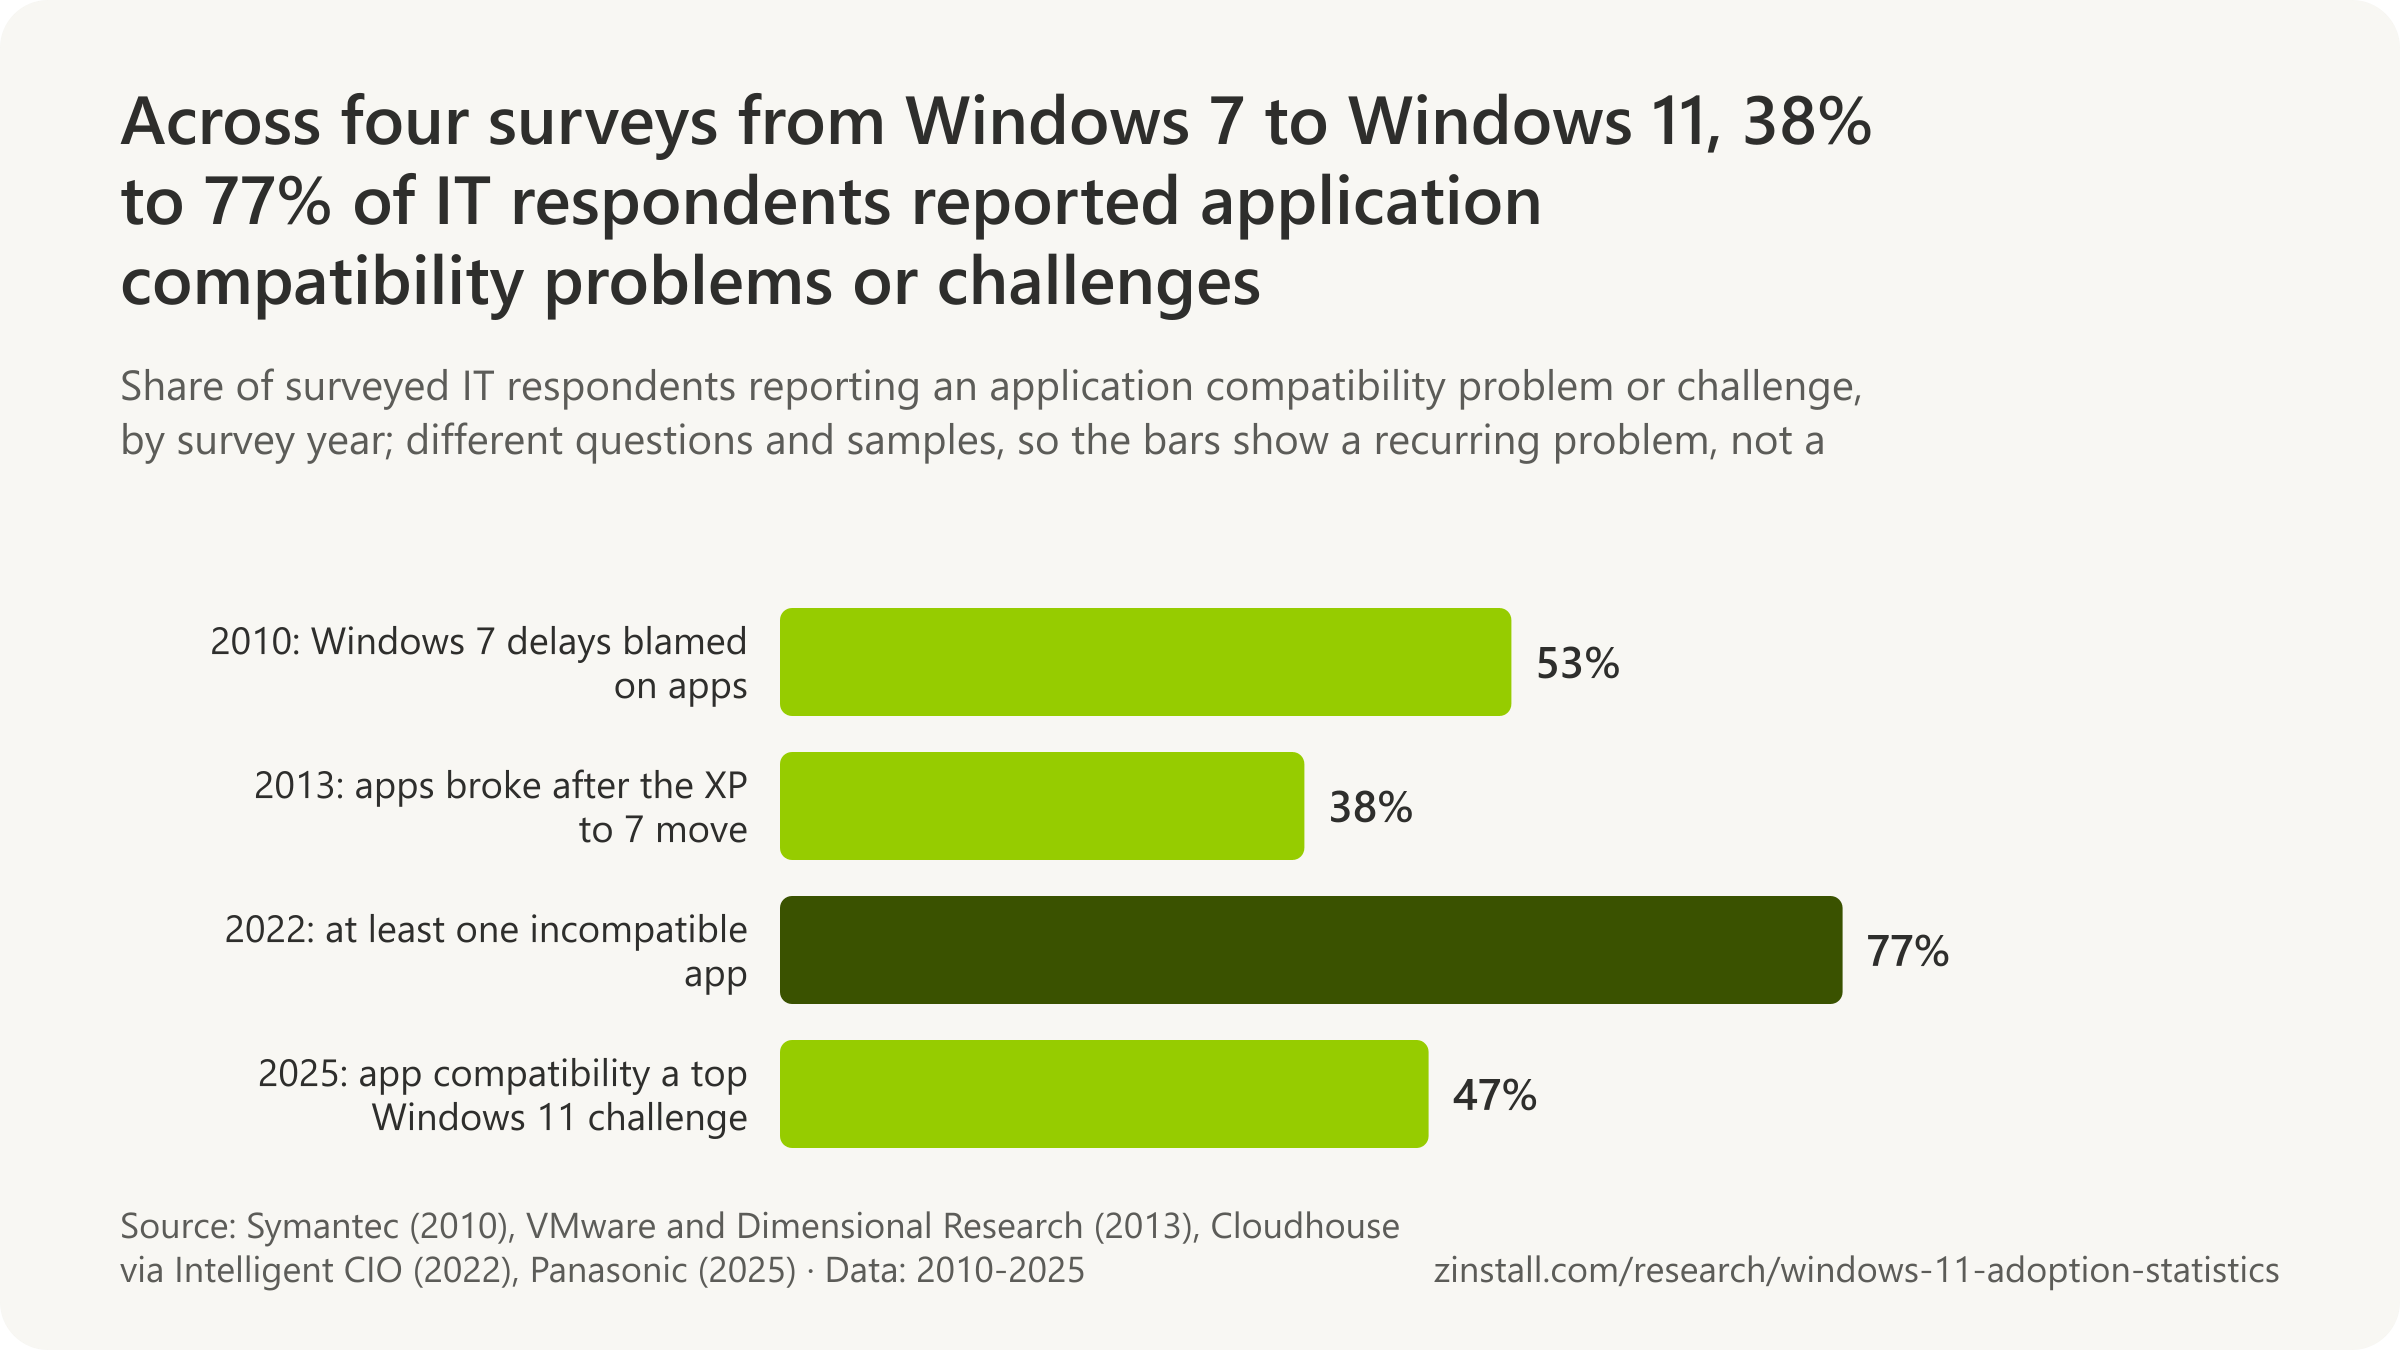
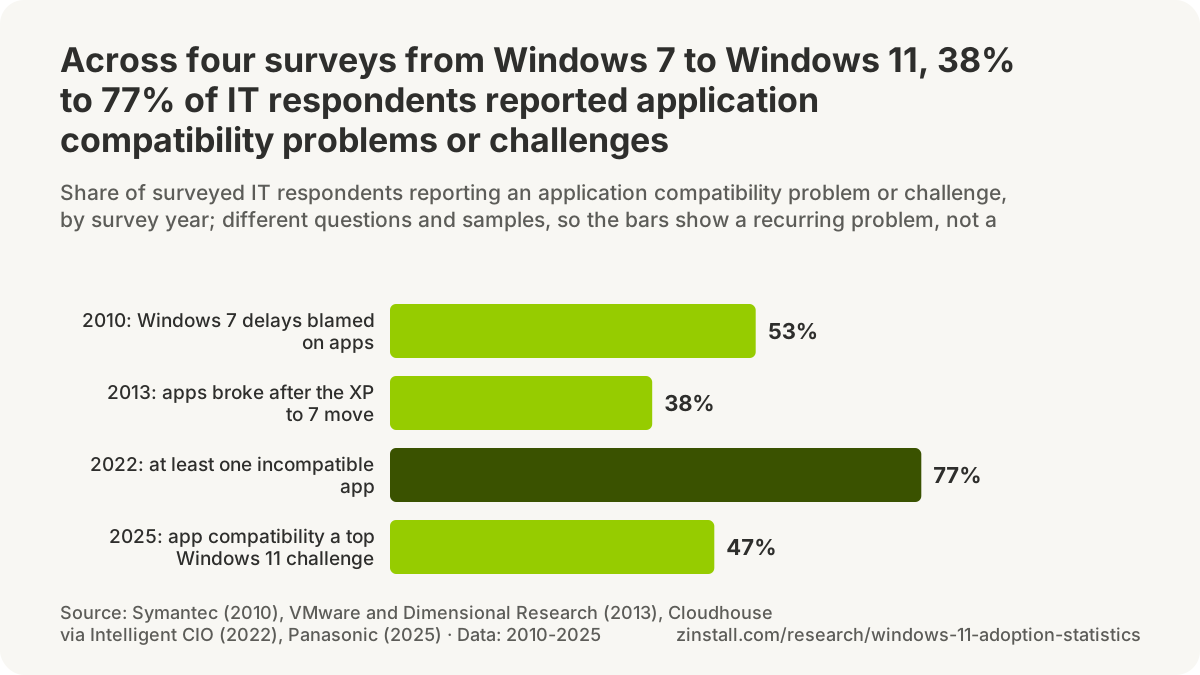
- Microsoft puts application compatibility from Windows 10 to Windows 11 at 99.7%, based on the apps businesses submit to it.
- 3,307 of the 837,699 apps Microsoft's App Assure service checked by October 2021 needed changes to run.
- 89% of the same CIOs said up to a quarter of their applications were incompatible with the latest Windows.
- 16-bit programs do not run on Windows 11 at all, because Windows 11 is 64-bit only.
- 47% of UK and German IT decision-makers named application compatibility a top Windows 11 migration challenge in 2025.
| Figure | Value |
|---|---|
| Customer apps evaluated by October 2021 | 837,699 |
| Share of evaluated apps compatible with the latest Windows | 99.6% |
| Compatibility rate Microsoft quotes for enterprises | 99.7% |
| Chance of hitting a compatibility issue, as Microsoft phrases it | 0.3% |
| Minimum fleet size for free App Assure help | 150 |
| Users spared an app problem, Microsoft's own claim | 44 million |
| Help-desk costs saved, Microsoft's own claim | $7.6 billion |
Sources: Cloudhouse; Microsoft (2026, 2025, 2023, 2021); Panasonic TOUGHBOOK; Symantec; Dimensional Research
More statistics (63)
77% of 200 surveyed UK and US CIOs said their organisation had at least one application not compatible with the latest version of Windows, in June 2022 (Cloudhouse survey via Intelligent CIO, 2022).
Microsoft's own compatibility figure is very high, and it comes from the applications businesses submitted to its App Assure service. Independent surveys of IT leaders tell a less tidy story, and the oldest programs face a hard limit: Windows 11 ships only as a 64-bit system, so 16-bit software does not run on it at all, while 32-bit programs still do. The software vendors' own support dates follow, because a program that runs is not the same as a program that is still supported.
- 837,699 customer apps had been evaluated by Microsoft's App Assure service in the three years to October 2021, of which 3,307 needed some level of remediation (Microsoft, 2021).
- 3,307 of the 837,699 customer apps evaluated by Microsoft's App Assure service needed some level of remediation to run on Microsoft's latest software, as of October 2021 (Microsoft, 2021).
- Over 99.6% of customer apps evaluated by Microsoft's App Assure service were compatible with the latest versions of Microsoft software without remediation, as of October 2021 (Microsoft, 2021).
- Over 99.7% is the Windows 10 compatibility rate for enterprise organisations, including line-of-business apps, that Microsoft's 'Plan for Windows 11' documentation attributes to App Assure data (Microsoft Learn, 2025).
- 0.3% is the chance of hitting an app compatibility issue on the way to Windows 11, as Microsoft phrases the complement of its 99.7% claim (Microsoft, 2023).
- 150 devices is the minimum fleet size Microsoft names for free App Assure help with Windows 11 app compatibility issues (Microsoft Learn, 2025).
- 89% of 200 surveyed UK and US CIOs said up to a quarter (25%) of their organisation's applications were incompatible with the latest version of Windows, in June 2022 (Cloudhouse survey via Intelligent CIO, 2022).
- 24% of 200 surveyed UK and US CIOs were 'not at all or not very confident' their organisation could make its platforms 100% compatible with the latest Windows, in June 2022 (Cloudhouse survey via Intelligent CIO, 2022).
- 20% of 200 surveyed UK and US CIOs had a comprehensive plan for application modernisation, and 25% believed they had ironed out most issues, in June 2022 (Cloudhouse survey via Intelligent CIO, 2022).
- 47% of 200 surveyed UK and German IT decision-makers named application and business software compatibility as a Windows 11 migration challenge, the most-cited of all, in March 2025 (Panasonic TOUGHBOOK, 2025).
- 53% of 1,360 IT respondents at businesses that had migrated to Windows 7 associated their delays with application incompatibility, ahead of hardware incompatibility (44%) and budget (40%), in 2010 (Symantec survey via Redmond Magazine, 2010).
- 20 hours of IT preparation on average was the top tier's investment in a Windows 7 migration, against nine hours for the bottom tier, among more than 1,300 IT managers surveyed by Symantec in 2010 (Symantec, 2010).
- 38% of 322 surveyed desktop administrators saw applications that would not work with Windows 7 after migrating users off Windows XP, in a January 2013 Dimensional Research survey for VMware (Redmond Channel Partner, 2013).
- Windows 11 'doesn't have a 32-bit version and is 64-bit only', so every Windows 11 installation is 64-bit, per Microsoft's 32-bit and 64-bit Windows FAQ (Microsoft Support, 2026).
- 16-bit programs, processes and components are not supported on 64-bit versions of Windows, which include every Windows 11 installation, per Microsoft's knowledge base article KB 896458 (Microsoft Learn, 2026).
- 32-bit Windows applications run on 64-bit Windows, including Windows 11, through WOW64, an x86 emulator shipped with the operating system that needs no enabling (Microsoft Learn, 2020).
- 54 features and capabilities are listed as removed from Windows client, from Windows 10 version 1507 to Windows 11 in August 2026, on Microsoft's removed-features page (Microsoft Learn, 2026).
- 84 features are listed as deprecated (no longer developed, to be removed) in Windows client as of September 2026 on Microsoft's deprecated-features page (Microsoft Learn, 2026).
- Internet Explorer 11's desktop application was retired and out of support from 15 June 2022 and is listed among features removed from Windows, with IE mode in Edge for legacy sites (Microsoft Learn, 2026).
- WordPad is removed from all editions of Windows from Windows 11 version 24H2 and Windows Server 2025, with Word or Notepad recommended instead (Microsoft Learn, 2026).
- 14 October 2025 was the end of extended support for Microsoft Office 2016, ten years after its 22 September 2015 start and five years after mainstream support ended on 13 October 2020 (Microsoft Lifecycle, 2025).
- 13 October 2026 was the retirement date of Office 2021, the one-time purchase for homes and small businesses on Windows and Mac, five years after its 5 October 2021 release, under the Modern Lifecycle Policy (Microsoft Lifecycle, 2024).
- Office 2016 and Office 2019 are listed as 'Not supported' on Windows 11 and Windows 10, while Office 2021 and Office 2024 are 'Supported' on Windows 11 and 'Supported (with exceptions)' on Windows 10, in Microsoft's 2026 support table (Microsoft Support, 2026).
- 31 May 2026 is the service discontinuation date for QuickBooks Desktop 2023 (Pro Plus, Premier Plus, Mac Plus, Enterprise Solutions 23.0), after which live support, payroll, payments and bank feeds stop (Intuit, 2026).
- Windows 11 (64-bit, natively installed) is the only client Windows version listed as supported for QuickBooks Desktop 2024; Windows 10 is not listed and 32-bit Windows is not supported (Intuit, 2026).
- No software updates or patches, including security patches, are provided for discontinued Quicken versions, under Quicken's discontinuation policy (Quicken, 2024).
- AutoCAD 2021 and 2022 (and their toolsets) are confirmed by Autodesk as fully supported on Windows 11, per the Autodesk partner IMAGINiT citing Autodesk's knowledge article (IMAGINiT, 2025).
- Creative Cloud apps from the 2023 releases onward are the versions Adobe lists as compatible with Windows 11; Creative Suite (CS6 and earlier) and pre-2023 Creative Cloud releases are not listed (Adobe, 2026).
- Over 99.6% was Microsoft's stated application compatibility rate 'with each release of Windows 10', based on App Assure evaluations, when it extended the promise to Windows 11 in October 2021 (Microsoft, 2021).
- Almost 800,000 apps had been evaluated by App Assure since 2018, according to Microsoft's 'Plan for Windows 11' documentation as last revised in March 2025 (Microsoft Learn, 2025).
- 150 or more licences per tenant is the eligibility threshold for Microsoft FastTrack, the benefit that includes App Assure (Microsoft Learn, 2026).
- No measured increase in support tickets was recorded during Microsoft's 190,000-device Windows 11 rollout, according to the company's internal IT team (Microsoft Inside Track, 2022).
- 99.7% is Microsoft's stated application compatibility rate for upgrading Windows 10 to Windows 11, described as 'as high as updating from older to newer versions of Windows 10' (Microsoft, 2023).
- Windows 11 application compatibility is 'to the same standard as Windows 10' according to Microsoft's Compatibility Cookbook page for Windows 11 (Microsoft Learn, 2022).
- Apps that work on Windows 7, 8.1, 10 or 11 'will work on Windows 365', Microsoft's App Assure promise for its Cloud PC service, with free remediation for eligible subscriptions (Microsoft, 2021).
- 50% of 200 surveyed UK and US CIOs said a significant amount of work remained to modernise applications for compatibility with newer Windows versions, in June 2022 (Cloudhouse survey via Intelligent CIO, 2022).
- 200 CIOs at UK and US enterprises were polled in Cloudhouse's June 2022 survey, of whom 55% planned to increase application modernisation budgets significantly (ERP Today, 2022).
- 47% of surveyed organisations 'noted software compatibility issues' as a Windows 11 migration concern, as TechRadar restated Panasonic's March 2025 survey of 200 UK and German IT decision-makers (TechRadar, 2025).
- Legacy application transition or replacement was Gartner's explanation for large businesses delaying Windows 10 upgrades until 2018, in its survey of 1,014 Windows 10 decision-makers in six countries (Gartner, 2017).
- 71% of 1,360 surveyed IT respondents preferred to replace applications that were incompatible with Windows 7, and 69% saw application virtualisation as a solution, in 2010 (Symantec survey via Redmond Magazine, 2010).
- 52% of IT managers in Symantec's 2010 Windows 7 survey cited application incompatibility as the biggest cause of migration delays, in TechCentral.ie's report (TechCentral.ie, 2010).
- Reinstalling applications was one of the three most time-consuming Windows 7 migration tasks, with planning and the upgrade itself, reported by 1,360 businesses surveyed for Symantec in 2010 (ESJ, 2010).
- 81.8% of 1,100 surveyed IT administrators cited time and resources or application compatibility concerns as the biggest barriers to deploying Windows 7, in July 2009 (ScriptLogic survey via InfoWorld, 2009).
- 16-bit Windows applications fail to launch on 64-bit Windows with ERROR_BAD_EXE_FORMAT because handles have 32 significant bits and cannot be truncated for 16-bit code, per Microsoft's WOW64 documentation (Microsoft Learn, 2020).
- Windows PowerShell 2.0, introduced with Windows 7 and deprecated in 2017, was removed from Windows 11 version 24H2 as of August 2025 (Microsoft Learn, 2026).
- Cortana in Windows as a standalone app was deprecated in June 2023 and is listed among deprecated Windows features (Microsoft Learn, 2026).
- VBScript was deprecated in October 2023 and will become a feature on demand before removal from Windows, affecting old installers and scripts that depend on it (Microsoft Learn, 2026).
- Some compatibility breaks are 'inevitable' with each new Windows version, while overall compatibility with existing apps 'is high', per the introduction to Microsoft's Windows Compatibility Cookbook (Microsoft Learn, 2021).
- Compatibility issues with older apps 'often' accompany each new Windows version, and Windows 11 ships a Program Compatibility Troubleshooter under Settings > System > Troubleshoot for them (Microsoft Support, 2026).
- 14 October 2025 was the end of extended support for Microsoft Office 2019, seven years after its 24 September 2018 start and two years after mainstream support ended on 10 October 2023 (Microsoft Lifecycle, 2025).
- 13 October 2026 was the end of support for Office LTSC 2021, the volume-licensed edition, after five years of mainstream support from 16 September 2021 and with no extended support phase (Microsoft Lifecycle, 2025).
- Office 2016 was supported on Windows 11 only by an exception Microsoft made 'to maximize customer access to Windows 11', since Office 2016 was already in extended support when Windows 11 shipped (Microsoft Lifecycle, 2026).
- No critical security updates are issued for discontinued QuickBooks Desktop versions, and users who do not upgrade lose live support and Intuit services such as payroll and bank feeds (Intuit, 2026).
- 30 April 2020 was the discontinuation date of Quicken 2017 for Windows and Mac, the last non-subscription version; Quicken 2015 and 2016 were discontinued on 30 April 2018 and 30 April 2019 (Quicken, 2024).
- Autodesk ends support for its software on any operating system once the OS vendor discontinues support, 'even if they are among the eligible previous versions', which applies to Windows 10 from 14 October 2025 (Autodesk, 2026).
- 0.39% of the customer apps evaluated by Microsoft's App Assure service by October 2021 needed remediation (3,307 of 837,699), the complement of Microsoft's 'over 99.6%' claim (Microsoft, 2021).
- 99.7% is the application compatibility rate Microsoft stated for enterprise organisations, including line-of-business apps, in its Windows 11 deployment-tools post on launch day, 4 October 2021 (Microsoft, 2021).
- 99.7 percent compatibility 'for all apps in Windows 11' is what Microsoft's internal IT team reported from App Assure data when it upgraded the company's own fleet in early 2022 (Microsoft Inside Track, 2022).
- 99.6% of 837,699 customer apps evaluated through App Assure 'were compatible with Windows 11', as BleepingComputer restated Microsoft's figure in March 2022 (BleepingComputer, 2022).
- 44 million users were prevented from 'ever running into a potential issue' with their apps by App Assure remediations, according to Microsoft's own estimate in October 2021 (Microsoft, 2021).
- $7.6 billion in help desk costs is Microsoft's own calculation of what App Assure remediations saved customers to October 2021 (Microsoft, 2021).
- 4.2 million manual hours is Nexthink's minimum estimate of the work to update the roughly 60% of 3.12 million analysed devices that were not Windows 11 compatible in 2022 (Nexthink, 2022).
Sources: Cloudhouse; Microsoft (2018-2026); Panasonic TOUGHBOOK; Symantec (2010); Dimensional Research; Intuit (2026); Quicken; IMAGINiT Technologies; Adobe; ERP Today; TechRadar; Gartner; TechCentral.ie; Enterprise Systems Journal; ScriptLogic; Autodesk; BleepingComputer; Nexthink
Is an unsupported Windows 10 PC at risk?
66.6% of the unpatched vulnerabilities found on Windows 10 PCs in mid-2026 were rated high or critical (Lansweeper, 2026).

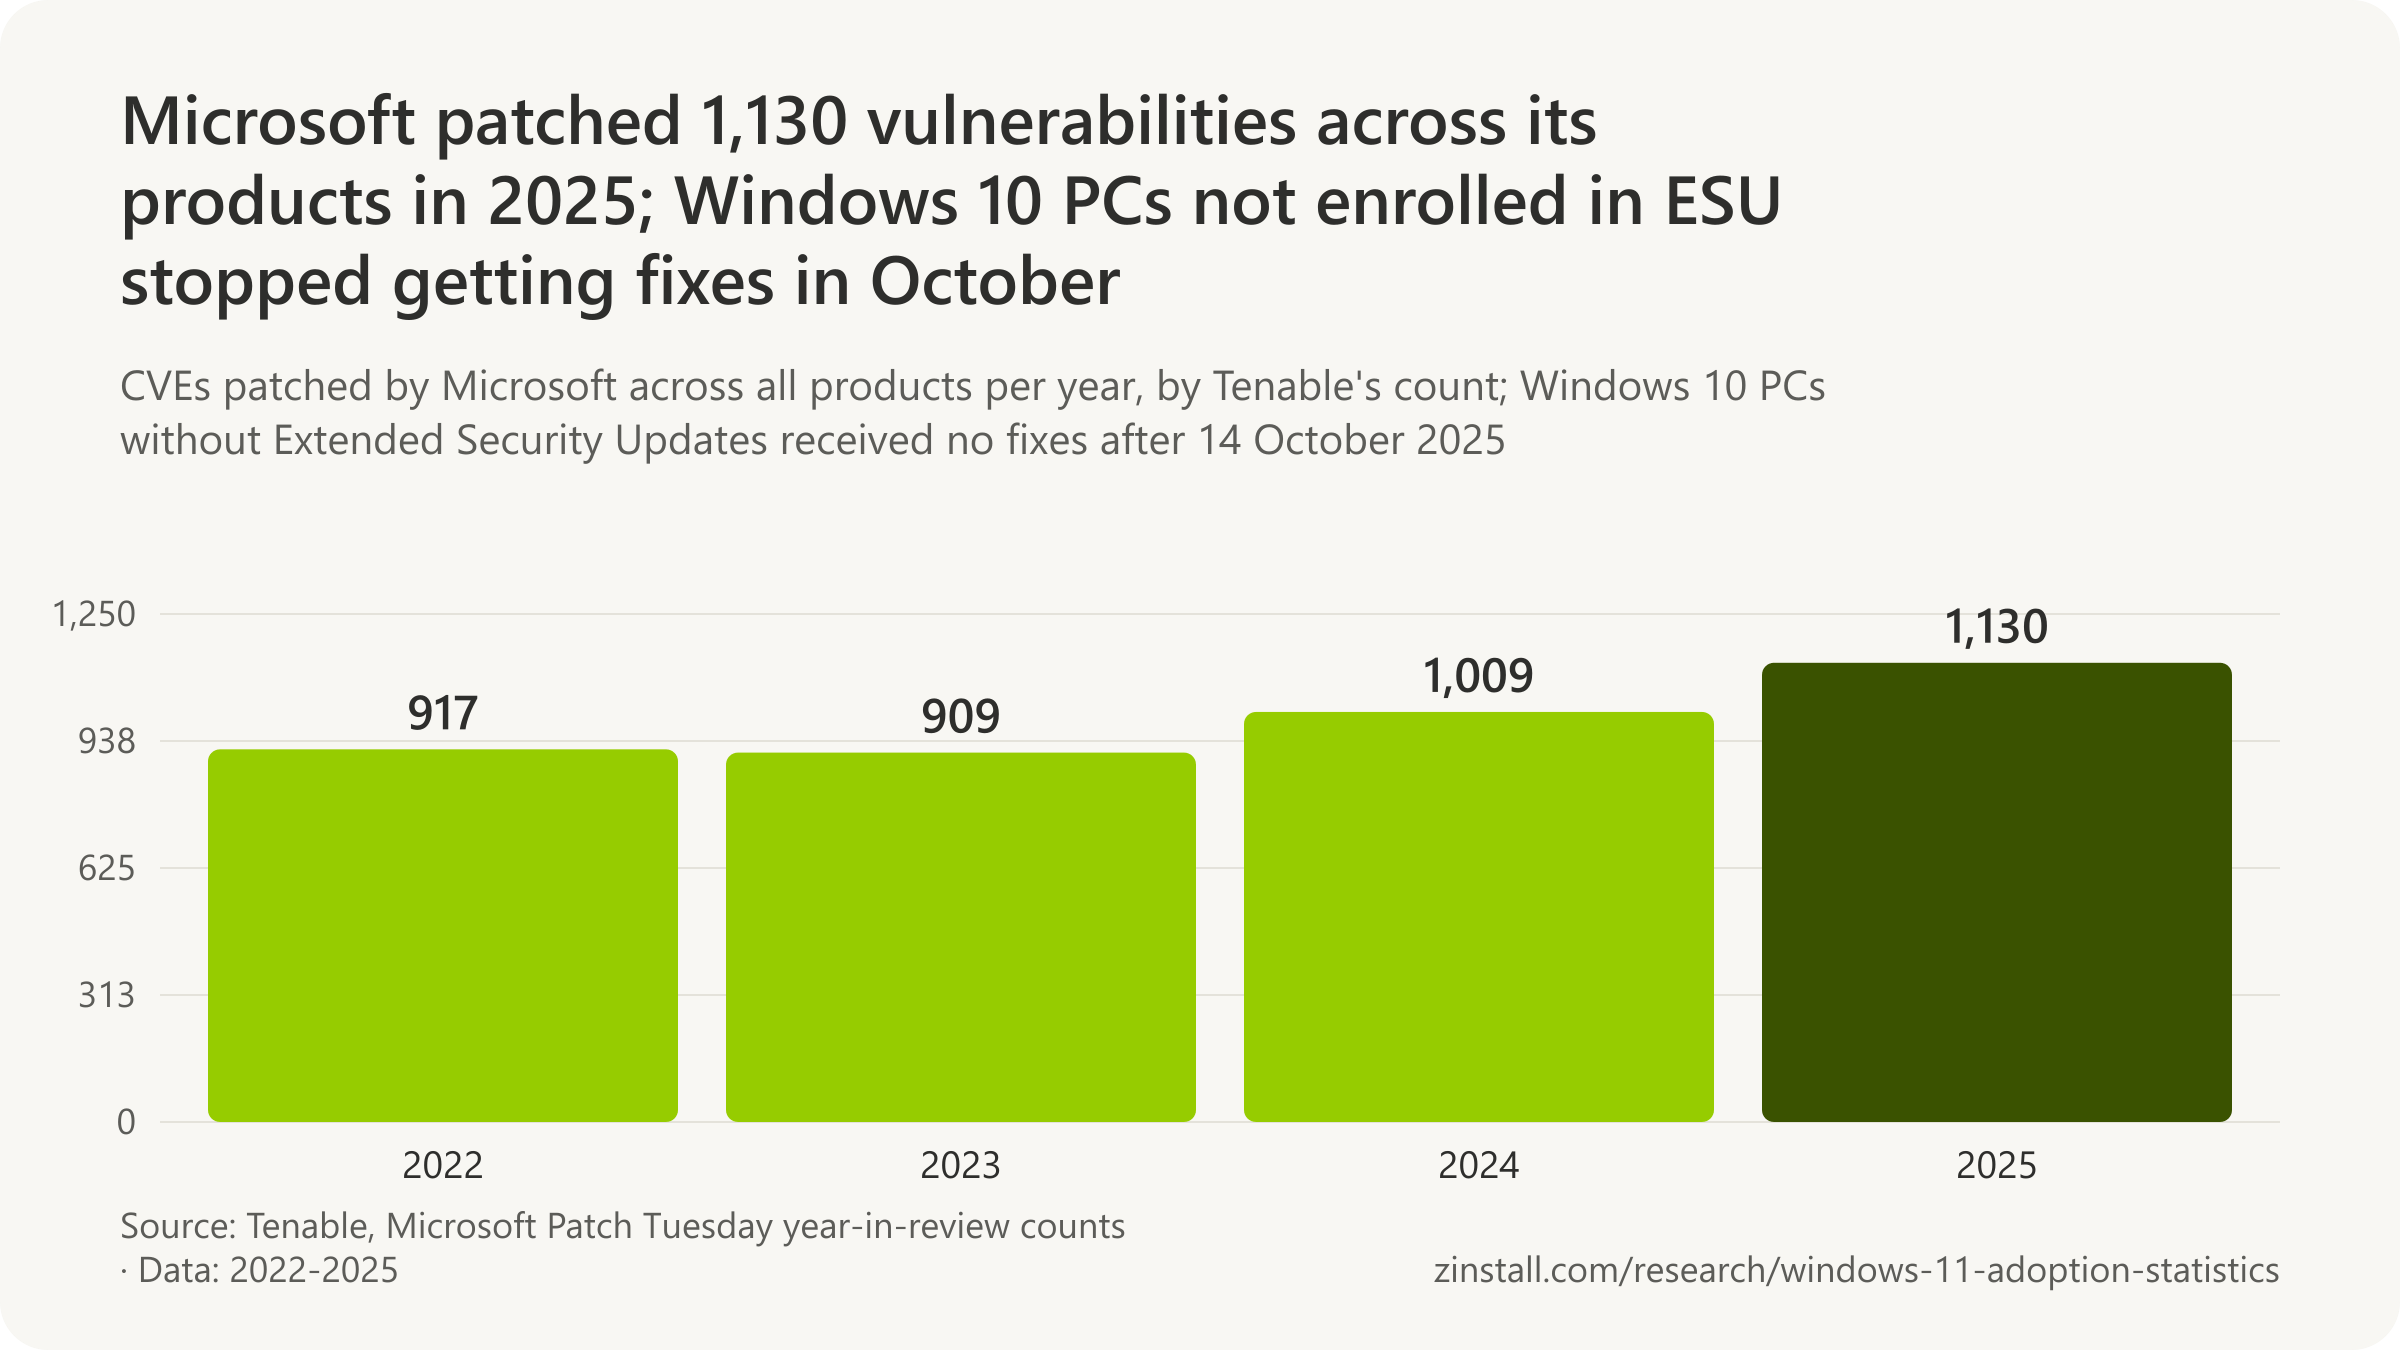
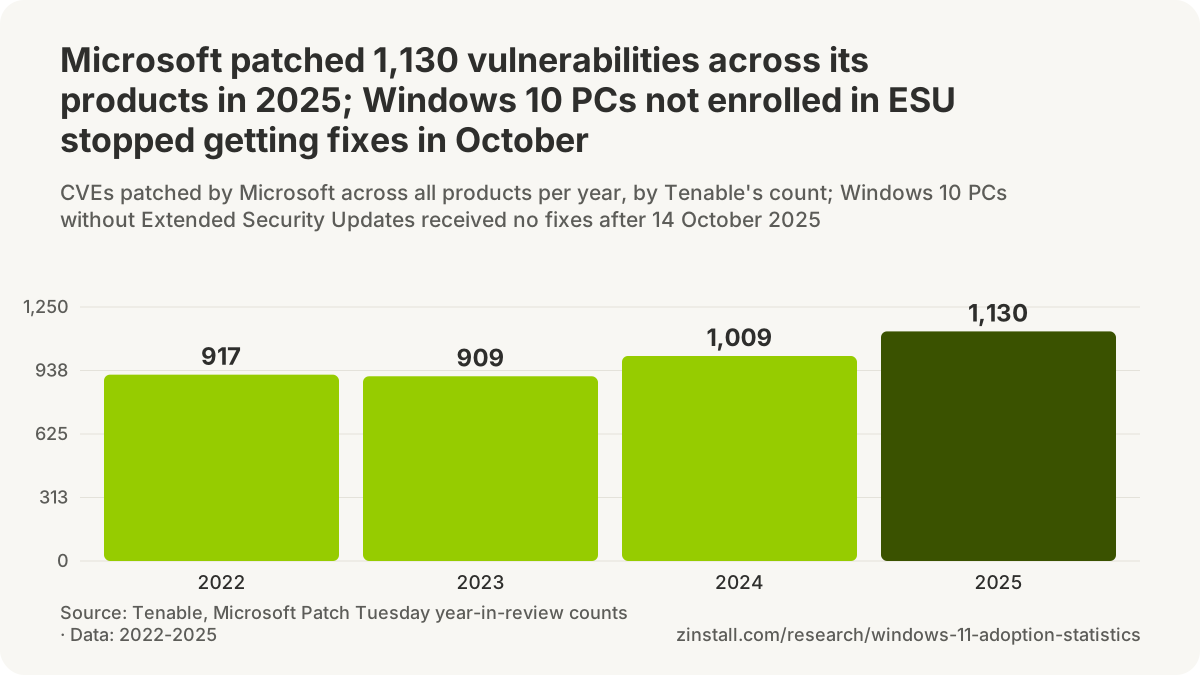
- The average Windows 10 PC carried 1,903 unpatched vulnerabilities in mid-2026, against 652 on a Windows 11 PC.
- 2.4% of those Windows 10 vulnerabilities were known to be exploited in the wild.
- 173 vulnerabilities, nine of them critical, were fixed in the October 2025 Patch Tuesday, the last update for Windows 10 PCs not enrolled in ESU.
- In the first half of 2013, Windows XP's malware infection rate was more than 5 times that of Windows 8.
- New Windows 11 PCs reported 62% fewer security incidents than older ones, in a study Microsoft commissioned.
| Year and counter | CVEs |
|---|---|
| 2024, all Microsoft products (Tenable) | 1,009 |
| 2024, all Microsoft products (Zero Day Initiative) | 1,020 |
| 2024, CVEs listing a Windows 10 edition (MSRC data, derived) | 549 |
| 2025, all Microsoft products (Tenable) | 1,130 |
| 2025, all Microsoft products (Zero Day Initiative) | 1,139 |
| 2025, CVEs listing a Windows 10 edition (MSRC data, derived; one month missing) | 617 (undercount) |
Sources: Lansweeper; Action1; Microsoft (2025, 2013); Tenable (2025, 2024); Zero Day Initiative (2025, 2024); Microsoft Security Response Center
More statistics (36)
66.6% of the active CVEs found on Windows 10 devices in Lansweeper's mid-2026 customer data were rated high or critical severity (Lansweeper, 2026).
An unsupported system keeps working; what changes is that newly found flaws are fixed in Windows 11 and not in Windows 10, which hands attackers a map. The evidence below is about associations between support status and infection or exposure rates, from Microsoft's own historical reports, from security vendors' analyses of their customers' devices, and from the agencies that advise on it. It is not advice, and the vendors' figures are labelled as theirs.
- 1,903 active CVEs were present on the average Windows 10 device in Lansweeper's mid-2026 customer inventory data, against 652 on the average Windows 11 device, a 2.9 times gap in the vendor's analysis (Lansweeper, 2026).
- 2.4% of the active CVEs on Windows 10 devices in Lansweeper's mid-2026 customer data were known to be exploited in the wild, about 1.7 times the rate on Windows 11 (Lansweeper, 2026).
- 1.7 times the Windows 11 rate: the share of active CVEs known to be exploited in the wild on Windows 10 devices was roughly 1.7 times that on Windows 11 devices in Lansweeper's mid-2026 customer data (Lansweeper, 2026).
- 173 vulnerabilities, including nine critical and six zero-days, were fixed in Microsoft's October 2025 Patch Tuesday, the last update Windows 10 PCs received without ESU enrolment, by Action1's count (Action1, 2025).
- 1,130 CVEs were patched by Microsoft across all products in its 2025 Patch Tuesday releases, a 12% increase on 1,009 in 2024, by Tenable's count (Tenable, 2025).
- 41 zero-day vulnerabilities were patched by Microsoft in 2025 Patch Tuesday releases, 24 of them exploited in the wild, by Tenable's count (Tenable, 2025).
- More than 5 times as high: Windows XP computers had an infection rate more than five times that of Windows 8 in the first half of 2013 while encountering about 31% more malware (Microsoft Security Intelligence Report volume 15, 2013).
- 9.1 computers per 1,000 running Windows XP SP3 were cleaned of malware per Malicious Software Removal Tool execution in the second quarter of 2013, against 1.6 per 1,000 on Windows 8 RTM (Microsoft Security Intelligence Report volume 15, 2013).
- 1.6 computers per 1,000 running Windows 8 RTM were cleaned of malware per Malicious Software Removal Tool execution in the second quarter of 2013, the lowest of the four client versions reported (Microsoft Security Intelligence Report volume 15, 2013).
- 16.3% of Windows XP SP3 computers running Microsoft real-time security products encountered malware in the second quarter of 2013, against 12.4% of Windows 8 RTM computers and 19.1% of Windows 7 SP1 computers (Microsoft Security Intelligence Report volume 15, 2013).
- Six times higher is how Microsoft's own blog restated the Windows XP to Windows 8 infection-rate gap from Security Intelligence Report volume 15 on 29 October 2013, where the report's text says 'more than 5 times' (Microsoft, 2013).
- Exploiting vulnerabilities in public-facing applications or unpatched operating systems was among the most prevalent initial access techniques Microsoft observed in ransomware attacks in July 2023 to June 2024, alongside phishing and identity compromise (Microsoft Digital Defense Report, 2024).
- 41% of consumers in Kaspersky Security Network telemetry used either an unsupported or an approaching-end-of-support desktop OS such as Windows XP or Windows 7 in August 2019, five months before Windows 7 support ended (Kaspersky, 2019).
- 15% of Windows 7 users worldwide were running older, no longer supported versions of Windows 7 in Avast's PC Trends Report 2019, drawn from 163 million devices (Avast, 2019).
- 9% of Windows 10 users worldwide were running older, no longer supported feature-update versions of Windows 10 in Avast's PC Trends Report 2019 (Avast, 2019).
- Computers running Windows 10 still function after 14 October 2025 but, without continued software and security updates, are at a greater risk for viruses and malware, Microsoft's support article states (Microsoft, 2025).
- 62% fewer security incidents and a 3 times reduction in firmware attacks were reported for new Windows 11 PCs in a Microsoft-commissioned 2024 study cited by Microsoft in June 2025 (Microsoft, 2025; vendor claim).
- An out-of-date operating system is a prime target for cyber criminals, the UK National Cyber Security Centre wrote on 14 July 2025 in urging organisations to leave Windows 10 before its 14 October 2025 end of life, citing the 2017 WannaCry exploitation of unpatched Windows XP (NCSC, 2025).
- Use of unsupported or end-of-life software in critical infrastructure is dangerous and significantly elevates risk to national security, the US Cybersecurity and Infrastructure Security Agency states in its Bad Practices catalogue, calling the practice especially egregious in internet-accessible technologies (CISA, 2021).
- 1,903 vulnerabilities per Windows 10 device against 652 on Windows 11, with 2.4% 'actively exploited', is how Help Net Security restated Lansweeper's July 2026 analysis (Help Net Security, 2026).
- More than 90% of ransomware cases that progressed to the ransom stage involved an unmanaged device in the network, used for initial access or to encrypt assets remotely, in Microsoft's telemetry for July 2023 to June 2024 (Microsoft Digital Defense Report, 2024).
- Over 90% of successful ransomware attacks exploit unmanaged endpoints is how Microsoft's own Windows business knowledge-center page restated its 2024 Digital Defense Report in September 2025, where the report says 'more than 90% of cases where attacks progressed to ransom stage' (Microsoft, 2025).
- 80 to 90 percent of all successful ransomware compromises originated through unmanaged devices, according to the Microsoft Digital Defense Report 2023 as quoted by SANS NewsBites in October 2023 (Microsoft via SANS, 2023).
- 55% of PC applications installed worldwide were out of date in Avast's PC Trends Report 2019, based on 163 million devices (Avast, 2019).
- 48% of small, medium-sized businesses and enterprises, and 40% of very small businesses, in Kaspersky Security Network telemetry still relied on unsupported or approaching-end-of-support desktop operating systems in August 2019 (Kaspersky, 2019).
- Windows 10 PCs will continue to function but no longer receive software and feature updates, security updates and fixes, or technical support, Microsoft states on its Windows 10 end-of-support page (Microsoft, 2026).
- Windows 10 devices will continue to function after end of support but will no longer receive regular security updates, making them more vulnerable to cyber threats such as malware and viruses, Microsoft's consumer marketing chief wrote in June 2025 (Microsoft, 2025).
- 549 distinct CVEs listed a Windows 10 edition among affected products in Microsoft's twelve monthly security update documents for 2024, against 570 listing Windows 11, by this page's count of the Microsoft Security Response Center's CVRF data (Microsoft Security Response Center, 2024).
- 617 distinct CVEs listed a Windows 10 edition among affected products in Microsoft's monthly security update documents for 2025, against 692 listing Windows 11, by this page's count of MSRC CVRF data, which lacks a November 2025 Patch Tuesday document and so undercounts both (Microsoft Security Response Center, 2025).
- 1,009 CVEs were patched by Microsoft across all products in 2024, against 909 in 2023 and 917 in 2022, by Tenable's count (Tenable, 2024).
- 1,139 CVEs were patched by Microsoft in 2025 by the Zero Day Initiative's count, the second-largest year on record after 2020, against 1,020 in 2024 (Zero Day Initiative, 2025).
- 1,020 CVEs were patched by Microsoft in 2024 by the Zero Day Initiative's count, second only to 2020 (Zero Day Initiative, 2024).
- Anyone who keeps delaying the switch from Windows 10 or does not move to extended support is riding a razor's edge, ESET's IT security expert Alexander Opel said in January 2026, when ESET counted about 21 million German household PCs still on Windows 10 (ESET, 2026).
- The situation is much more dangerous than when support for Windows 7 ended in 2020, ESET's Thorsten Urbanski said in January 2025, when ESET estimated 32 million PCs in Germany on Windows 10 (ESET via Computerworld, 2025).
- 18.7% of the Windows devices in Lansweeper's customer fleets ran an end-of-life operating system in July 2026 (Windows 10, 7, 8.1 or XP), rising to 40.9% when versions losing support within six months are added (Lansweeper, 2026).
| Year and counter | CVEs | Scope |
|---|---|---|
| 2024, all Microsoft products (Tenable) | 1,009 | CVEs addressed in Microsoft's monthly Patch Tuesday releases, all Microsoft products, as counted by Tenable · Worldwide · 2024 |
| 2024, all Microsoft products (Zero Day Initiative) | 1,020 | CVEs addressed in Microsoft security releases, all Microsoft products, as counted by Trend Micro's Zero Day Initiative · Worldwide · 2024 |
| 2024, CVEs listing a Windows 10 edition (MSRC data, derived) | 549 | CVEs published in Microsoft's monthly CVRF security update documents whose affected-product list names a Windows 10 edition (all status types), counted by document year · Worldwide · 2024 |
| 2025, all Microsoft products (Tenable) | 1,130 | CVEs addressed in Microsoft's monthly Patch Tuesday releases, all Microsoft products, as counted by Tenable · Worldwide · 2025 |
| 2025, all Microsoft products (Zero Day Initiative) | 1,139 | CVEs addressed in Microsoft security releases, all Microsoft products, as counted by Trend Micro's Zero Day Initiative (excluding Azure Linux and CBL Mariner updates) · Worldwide · 2025 |
| 2025, CVEs listing a Windows 10 edition (MSRC data, derived; one month missing) | 617 (undercount) | CVEs published in Microsoft's monthly CVRF security update documents whose affected-product list names a Windows 10 edition (all status types), counted by document year · Worldwide · 2025 |
Sources: Lansweeper; Action1; Tenable (2024, 2025); Microsoft (2013-2026); Kaspersky; Avast; UK National Cyber Security Centre; US Cybersecurity and Infrastructure Security Agency; Help Net Security; Microsoft Security Response Center; Zero Day Initiative (2024, 2025); ESET Deutschland; ESET
PC sales and e-waste from the Windows 11 refresh
270 million PCs shipped worldwide in 2025, up 9.1% on 2024, growth attributed mainly to the Windows 11 upgrade cycle (Gartner, 2026).

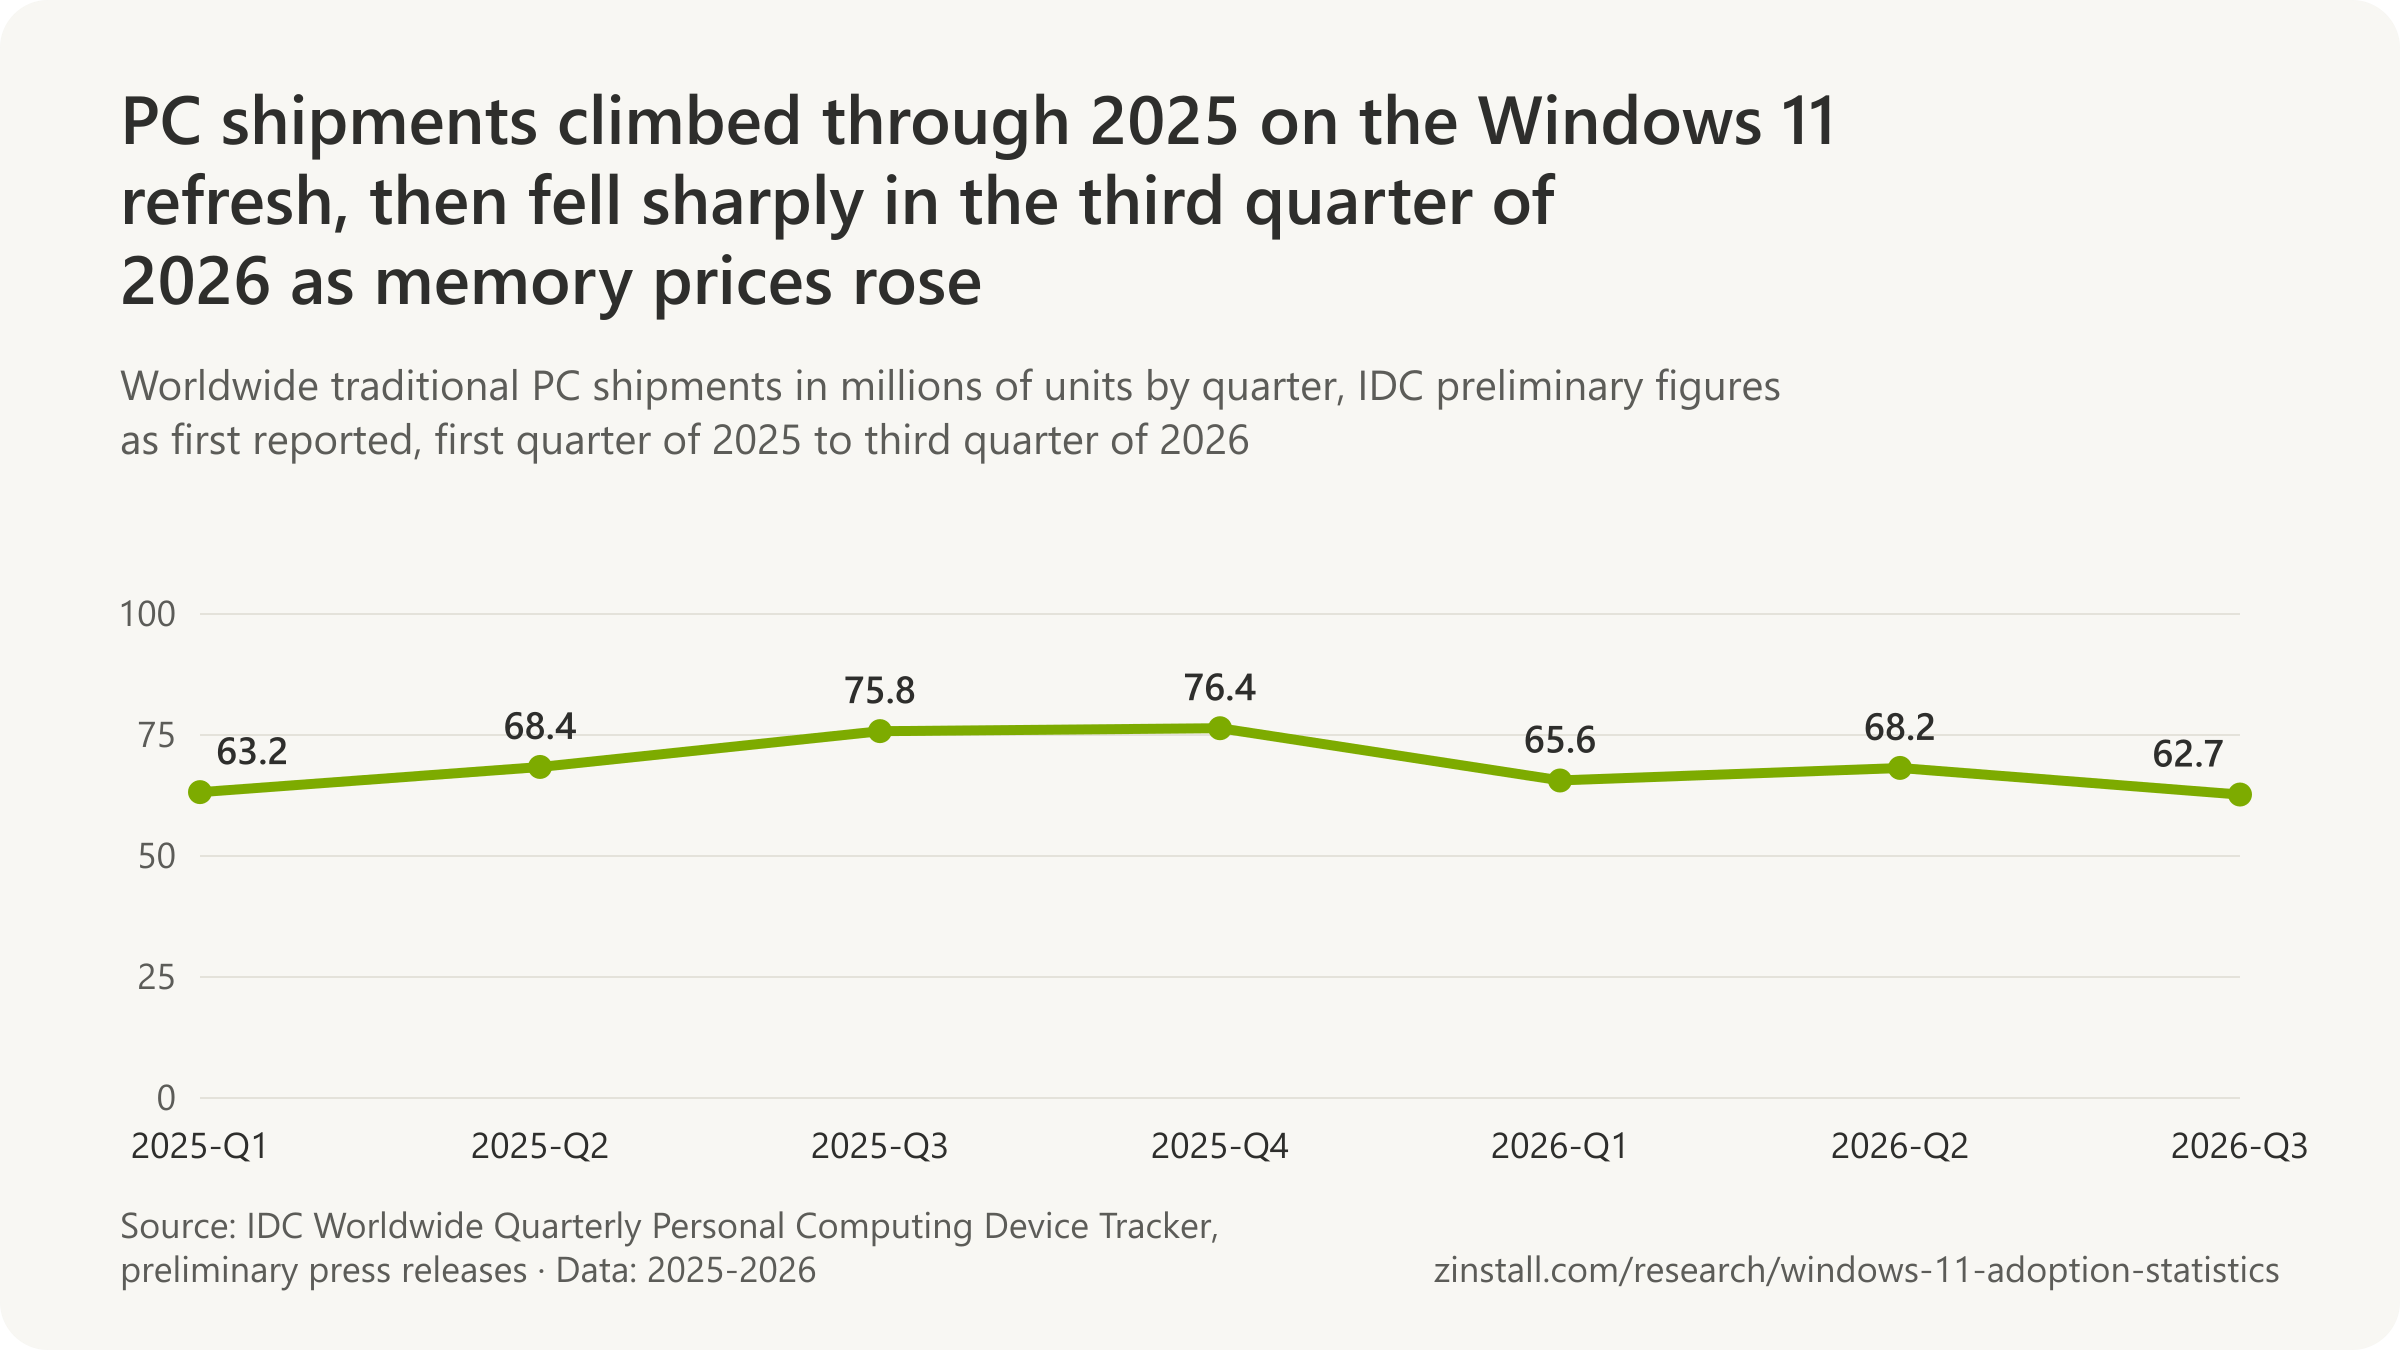
- A second count put 2025 shipments at 284.7 million, up 8.1%.
- Shipments then fell 22.4% year on year in the third quarter of 2026, to 55.4 million, as memory prices surged.
- PC shipments were forecast to drop 10.4% in 2026 because of soaring memory costs.
- The end of Windows 10 could create 1.6 billion pounds of electronic waste, one advocacy estimate says.
- The world generated a record 62 billion kg of e-waste in 2022, 7.8 kg per person.
| Quarter and firm | Units |
|---|---|
| Q3 2025, Gartner | 69.9 million |
| Q3 2025, IDC | 75.8 million |
| Q4 2025, Gartner | 71.5 million |
| Q4 2025, IDC | 76.4 million |
| Q1 2026, Gartner | 62.8 million |
| Q1 2026, IDC | 65.6 million |
| Q2 2026, IDC | 68.2 million |
| Q3 2026, IDC | 62.7 million |
Sources: Gartner, Inc. (2025, 2026); International Data Corporation (2025, 2026); U.S. PIRG; UNITAR and ITU
More statistics (115)
270.2 million PCs were shipped worldwide in 2025, up 9.1% from 2024, growth Gartner attributes mainly to the Windows 11 upgrade cycle (Gartner preliminary, 2026).
The end of Windows 10 support set off the first sustained PC refresh since the pandemic, and then memory prices cut it short. The three market trackers count shipments differently and are kept as separate series; the analysts' own words on what drove each quarter are recorded beside the numbers. The other side of a refresh is the machines it retires, and the estimates of how many will be scrapped are campaign figures as much as measurements, so the page shows them as such, beside the only global measure of e-waste that exists.
- 284.7 million traditional PCs were shipped worldwide in 2025, up 8.1% from 2024 (IDC preliminary, 2026).
- 278.7 million desktops, notebooks and workstations were shipped worldwide in 2025, up 9.1% from 2024 (Omdia, 2026).
- Worldwide PC shipments in the third quarter of 2025 were driven by the Windows 10 end-of-support refresh cycle in most regions, while North America's growth was limited to 1.6% (Gartner, 2025).
- IDC described 2025 as a year marked by the end of support for Windows 10, which drove a wave of upgrade demand, and by tariff concerns and memory shortages that pulled inventory forward (IDC, 2026).
- Tariff volatility, anticipated memory price hikes in 2026 and the rising cost of Windows 10 Extended Security Updates prompted businesses to prioritise replacing hardware in 2025, Gartner said (Gartner, 2026).
- The 4% year-on-year PC shipment growth in the first quarter of 2026 was artificially inflated by vendors and distributors building inventory ahead of expected second-quarter price hikes driven by memory price inflation, Gartner said (Gartner, 2026).
- 68.2 million traditional PCs were shipped worldwide in the second quarter of 2026, down 4.9% year on year (IDC preliminary, 2026).
- 55.4 million PCs were shipped worldwide in the third quarter of 2026, down 22.4% year on year (Gartner preliminary, 2026).
- 62.7 million traditional PCs were shipped worldwide in the third quarter of 2026, down 20.1% year on year (IDC preliminary, 2026).
- DRAM costs surged five times year on year in the second quarter of 2026 and PC shipments in the third quarter fell to levels last seen in early 2023, Gartner said (Gartner, 2026).
- PC vendors including Lenovo, Dell, HP, Acer and ASUS confirmed price increases of 15% to 20% as the memory shortage collided with the Windows 10 end-of-life refresh cycle, IDC wrote in December 2025 (IDC, 2025).
- Worldwide PC shipments were forecast to decline 10.4% in 2026 compared with 2025 because of soaring memory costs (Gartner forecast, 2026).
- Global PC shipments were forecast to decline 11.3% in 2026, cut from a -2.4% outlook published in November 2025, because of memory shortages and supply constraints (IDC forecast, 2026).
- PC lifetimes were expected to lengthen by 15% for business buyers and 20% for consumers by the end of 2026 as rising costs delayed upgrades (Gartner forecast, 2026).
- More than half of B2B channel partners polled by Omdia in June 2026 said their customers were putting off hardware refresh plans until the market stabilised, and 6% expected outright cancellations, eight months after the Windows 10 deadline (Omdia, 2026).
- 'More cost-sensitive customers are extending their upgrade cycles,' increasing the number of older devices in the installed base, Dell's COO said on 1 September 2026 as memory prices pushed PC prices up (Dell, 2026).
- HP's revenue of $14.4 billion in its fiscal first quarter 2026 was up 7% year on year, driven by Personal Systems and the positive impact on PC demand from the Windows 11 refresh cycle, HP said (HP, 2026).
- 33% of all Lenovo PC shipments in the quarter to September 2025 were AI PCs, and Lenovo held a 31.1% share of the Windows AI PC segment (Lenovo, 2025).
- 241.8 million PCs were shipped worldwide in 2023, down 14.8% from 2022, the first year below 250 million since 2006 (Gartner preliminary, 2024).
- 245.3 million PCs were shipped worldwide in 2024, up 1.3% from 2023 (Gartner preliminary, 2025).
- 259.5 million traditional PCs were shipped worldwide in 2023, down 13.9% from 2022 (IDC preliminary, 2024).
- 262.7 million traditional PCs were shipped worldwide in 2024, up 1.0% from 2023 (IDC preliminary, 2025).
- The business PC market was ready for its next replacement cycle driven by Windows 11 upgrades, Gartner said when reporting the third quarter of 2023 (Gartner, 2023).
- IDC said in October 2023 that a device refresh cycle and the end of support for Windows 10 would help drive PC sales in the second half of 2024 and beyond (IDC, 2023).
- Demand for the Windows PC refresh driven by the end of Windows 10 support in 2025 did not fully pick up in the third quarter of 2024, Gartner said (Gartner, 2024).
- Many businesses had begun refreshing PCs in preparation for the end of Windows 10 support by the third quarter of 2024, with Japan growing double digits and leading the transition (IDC, 2024).
- Gartner expected solid PC shipment growth in 2025 reflecting delayed Windows 11 PC refresh demand, after only modest growth of 1.4% in the fourth quarter of 2024 (Gartner, 2025).
- IDC credited part of the fourth-quarter 2024 result to enterprises continuing to upgrade hardware before the Windows 10 end of support scheduled for October 2025 (IDC, 2025).
- 15.6% year-on-year PC shipment growth in Japan in the first quarter of 2025 was driven by strong business PC demand for Windows 11 replacements and Chromebook adoption (Gartner, 2025).
- IDC said the underlying demand factors for PCs, such as the installed base upgrade ahead of Windows 10 end of support, remained strong in the first quarter of 2025 (IDC, 2025).
- Gartner reported in the second quarter of 2025 that the expected surge in new device purchases had been subdued because many organizations chose to update existing PCs to Windows 11 rather than invest in new hardware (Gartner, 2025).
- Gartner forecast in July 2025 that worldwide PC shipments would rise 2.4% in 2025, propelled by tariff-driven front-loading in the U.S. and Windows 11 replacement cycles elsewhere; the actual preliminary result was 9.1% (Gartner, 2025).
- Outside a flat US market, PC demand in the second quarter of 2025 was fuelled by an aging installed base and a steady transition to Windows 11, IDC said (IDC, 2025).
- IDC said third-quarter 2025 PC demand was driven largely by Japan's hardware refresh linked to Windows 10 end-of-support and the GIGA education project, with slower Windows 11 adoption elsewhere (IDC, 2025).
- 'Demand for newer PCs ready for Windows 11 is likely to push well into 2026,' IDC said in October 2025, attributing the year's shipment growth to the Windows 11 transition and an ageing installed base (IDC, 2025).
- First-quarter 2026 PC shipment growth of 2.5% was mostly fuelled by anticipation of rising component prices, Windows 10 migration and new product introductions, IDC said (IDC, 2026).
- Worldwide PC shipments decreased moderately year on year in the second quarter of 2026, impacted by higher memory costs, according to Gartner's preliminary market share alert (Gartner, 2026).
- IDC said in July 2026 that the memory shortage was not expected to ease until early 2028 and that sustained cost pressure could temper the broader PC upgrade cycle (IDC, 2026).
- IDC said in October 2026 that PC prices would remain elevated and that the outlook for the next few quarters could get worse before it gets better, after shipments fell 20.1% in the third quarter (IDC, 2026).
- A 130% surge in combined DRAM and SSD prices by the end of 2026 was expected to raise PC prices by 17% compared with 2025 levels (Gartner forecast, 2026).
- PC memory costs were expected to peak at 23% of the bill of materials in 2026, up from 16% in 2025, and the sub-$500 entry-level PC segment was expected to disappear by 2028 (Gartner forecast, 2026).
- Despite an 11.3% unit decline, the worldwide PC market was forecast to grow 1.6% in value to $274 billion in 2026 because of higher average selling prices (IDC forecast, 2026).
- IDC expected fourth-quarter 2026 PC shipments to fall about 20% year on year and PC average selling prices to rise 17% in 2026, with no quick fix to the memory shortage (IDC forecast, 2026).
- Worldwide shipments of desktops, notebooks and workstations were forecast to decline 12% to 245 million units in 2026 because of memory and storage price increases (Omdia forecast, 2026).
- Windows PCs, 83% of worldwide PC shipments, were forecast to decline 12% in 2026, Chrome devices 28% and Macs 5% (Omdia forecast, 2026).
- Memory and storage costs for PCs had risen roughly five-fold and three-fold respectively since the first quarter of 2025 by April 2026, as AI data centres crowded consumer categories out of supply (Omdia, 2026).
- Mainstream PC memory and storage costs rose by 40% to 70% between the first and fourth quarters of 2025, with the increases passed through to customers (Omdia, 2026).
- Global notebook shipments were projected to fall 14.8% quarter on quarter in the first quarter of 2026 under dual pressure from rising CPU and memory prices, and the full-year 2026 notebook forecast was cut to a 9.4% decline (TrendForce forecast, 2026).
- PC DRAM contract prices were projected to rise by more than 100% quarter on quarter in the first quarter of 2026, a record quarterly surge, after PC shipments in late 2025 exceeded expectations and drained inventories (TrendForce, 2026).
- Global notebook shipments were forecast to decline 13.6% in 2026 after a stronger than expected first half, weaker second-half demand and rising end-market prices (TrendForce forecast, 2026).
- Conventional DRAM contract prices were forecast to rise 13% to 18% quarter on quarter in the third quarter of 2026, and retail notebook prices were expected to rise across the board as costlier components flowed through inventories (TrendForce forecast, 2026).
- Conventional DRAM contract prices were projected to rise another 10% to 15% quarter on quarter in the fourth quarter of 2026, with notebook inventories increasingly reflecting higher component costs and weighing on sales (TrendForce forecast, 2026).
- AI-capable PC shipments were forecast to surpass 100 million in 2025, 40% of all PC shipments, after an estimated 48 million (18%) in 2024 (Canalys forecast, 2024).
- Lenovo told investors in February 2026 that near-term Windows end-of-support and PC refresh remained a tailwind for its PC business (Lenovo, 2026).

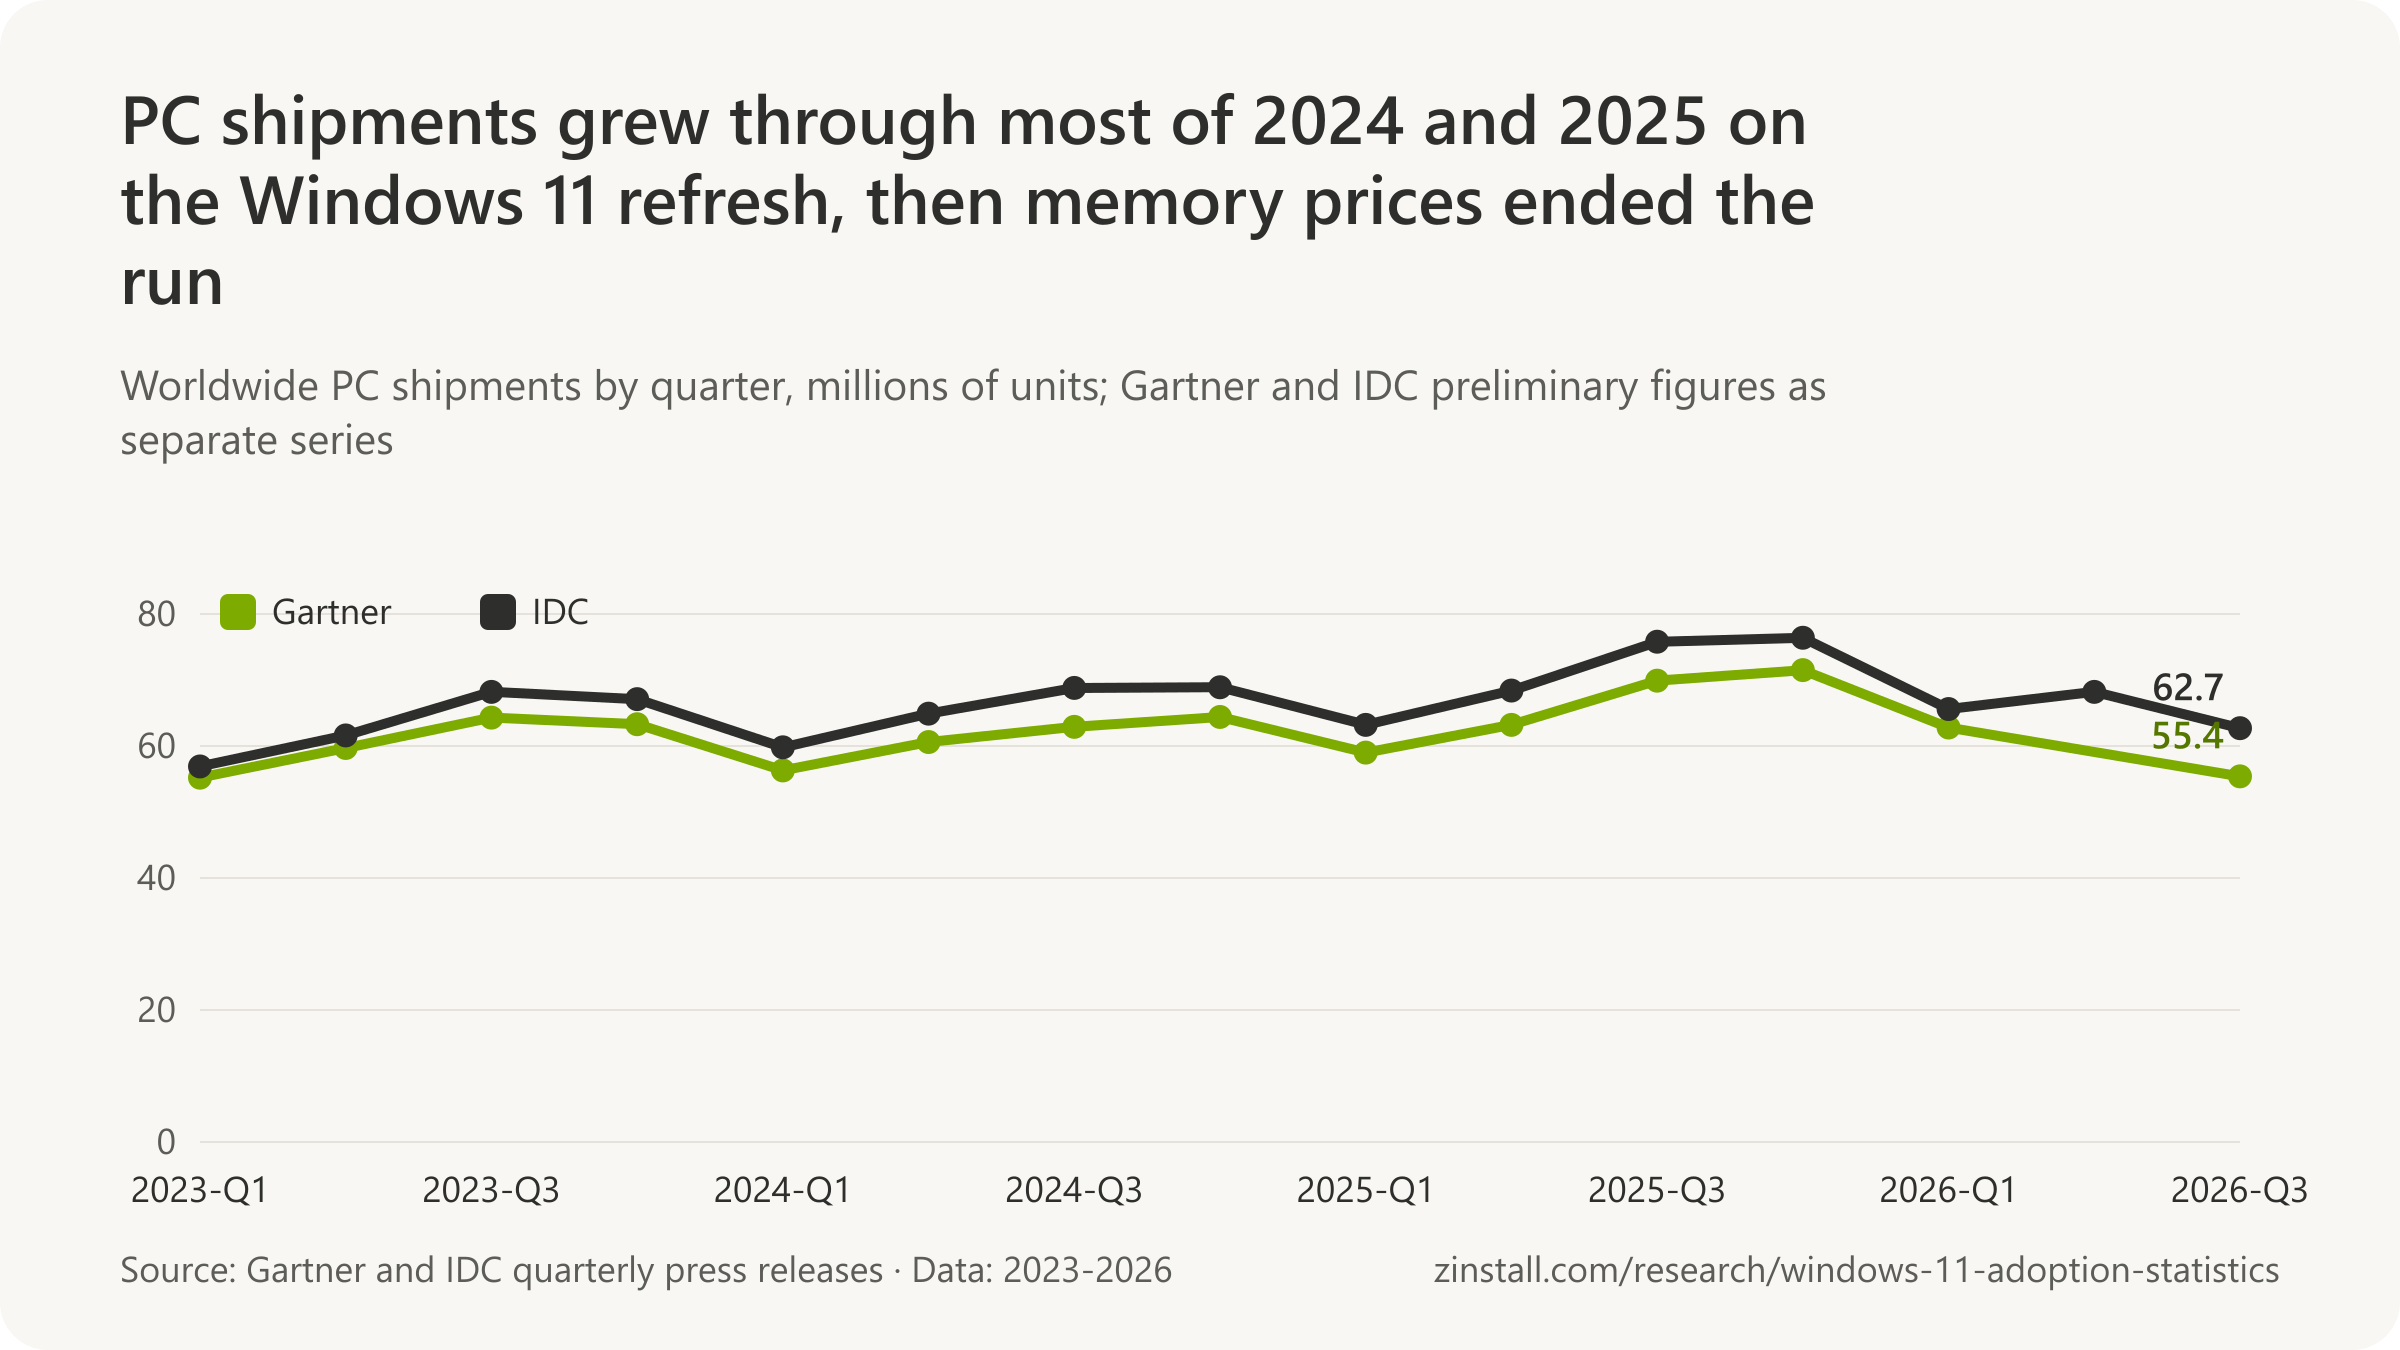
| Quarter and firm | Units | Scope |
|---|---|---|
| Q3 2025, Gartner | 69.9 million | desktop and laptop PCs (Windows, macOS, Chrome OS) shipped into channels worldwide, Gartner preliminary estimate · Worldwide · 2025-Q3 |
| Q3 2025, IDC | 75.8 million | traditional PCs (desktops, notebooks, workstations; no tablets or x86 servers) shipped worldwide, IDC Worldwide Quarterly Personal Computing Device Tracker preliminary results · Worldwide · 2025-Q3 |
| Q4 2025, Gartner | 71.5 million | desktop and laptop PCs (Windows, macOS, Chrome OS) shipped into channels worldwide, Gartner preliminary estimate · Worldwide · 2025-Q4 |
| Q4 2025, IDC | 76.4 million | traditional PCs (desktops, notebooks, workstations; no tablets or x86 servers) shipped worldwide, IDC Worldwide Quarterly Personal Computing Device Tracker preliminary results · Worldwide · 2025-Q4 |
| Q1 2026, Gartner | 62.8 million | desktop and laptop PCs (Windows, macOS, Chrome OS) shipped into channels worldwide, Gartner preliminary estimate · Worldwide · 2026-Q1 |
| Q1 2026, IDC | 65.6 million | traditional PCs (desktops, notebooks, workstations; no tablets or x86 servers) shipped worldwide, IDC Worldwide Quarterly Personal Computing Device Tracker preliminary results · Worldwide · 2026-Q1 |
| Q2 2026, IDC | 68.2 million | traditional PCs (desktops, notebooks, workstations; no tablets or x86 servers) shipped worldwide, IDC Worldwide Quarterly Personal Computing Device Tracker preliminary results · Worldwide · 2026-Q2 |
| Q3 2026, Gartner | 55.4 million | desktop and laptop PCs (Windows, macOS, Chrome OS) shipped into channels worldwide, Gartner preliminary estimate · Worldwide · 2026-Q3 |
| Q3 2026, IDC | 62.7 million | traditional PCs (desktops, notebooks, workstations; no tablets or x86 servers) shipped worldwide, IDC Worldwide Quarterly Personal Computing Device Tracker preliminary results · Worldwide · 2026-Q3 |
| Quarter and firm | Units | Scope |
|---|---|---|
| Q1 2023, Gartner | 55.2 million | desktop and laptop PCs (Windows, macOS, Chrome OS) shipped into channels worldwide, Gartner preliminary estimate · Worldwide · 2023-Q1 |
| Q1 2023, IDC | 56.9 million | traditional PCs (desktops, notebooks, workstations; no tablets or x86 servers) shipped worldwide, IDC Worldwide Quarterly Personal Computing Device Tracker preliminary results · Worldwide · 2023-Q1 |
| Q2 2023, Gartner | 59.7 million | desktop and laptop PCs (Windows, macOS, Chrome OS) shipped into channels worldwide, Gartner preliminary estimate · Worldwide · 2023-Q2 |
| Q2 2023, IDC | 61.6 million | traditional PCs (desktops, notebooks, workstations; no tablets or x86 servers) shipped worldwide, IDC Worldwide Quarterly Personal Computing Device Tracker preliminary results · Worldwide · 2023-Q2 |
| Q3 2023, Gartner | 64.3 million | desktop and laptop PCs (Windows, macOS, Chrome OS) shipped into channels worldwide, Gartner preliminary estimate · Worldwide · 2023-Q3 |
| Q3 2023, IDC | 68.2 million | traditional PCs (desktops, notebooks, workstations; no tablets or x86 servers) shipped worldwide, IDC Worldwide Quarterly Personal Computing Device Tracker preliminary results · Worldwide · 2023-Q3 |
| Q4 2023, Gartner | 63.4 million | desktop and laptop PCs (Windows, macOS, Chrome OS) shipped into channels worldwide, Gartner preliminary estimate · Worldwide · 2023-Q4 |
| Q4 2023, IDC | 67.1 million | traditional PCs (desktops, notebooks, workstations; no tablets or x86 servers) shipped worldwide, IDC Worldwide Quarterly Personal Computing Device Tracker preliminary results · Worldwide · 2023-Q4 |
| Q1 2024, Gartner (as restated in April 2025) | 56.3 million | desktop and laptop PCs (Windows, macOS, Chrome OS) shipped into channels worldwide, Gartner preliminary estimate · Worldwide · 2024-Q1 |
| Q1 2024, IDC | 59.8 million | traditional PCs (desktops, notebooks, workstations; no tablets or x86 servers) shipped worldwide, IDC Worldwide Quarterly Personal Computing Device Tracker preliminary results · Worldwide · 2024-Q1 |
| Q2 2024, Gartner | 60.7 million | desktop and laptop PCs (Windows, macOS, Chrome OS) shipped into channels worldwide, Gartner preliminary estimate · Worldwide · 2024-Q2 |
| Q2 2024, IDC | 64.9 million | traditional PCs (desktops, notebooks, workstations; no tablets or x86 servers) shipped worldwide, IDC Worldwide Quarterly Personal Computing Device Tracker preliminary results · Worldwide · 2024-Q2 |
| Q3 2024, Gartner | 63.0 million | desktop and laptop PCs (Windows, macOS, Chrome OS) shipped into channels worldwide, Gartner preliminary estimate · Worldwide · 2024-Q3 |
| Q3 2024, IDC | 68.8 million | traditional PCs (desktops, notebooks, workstations; no tablets or x86 servers) shipped worldwide, IDC Worldwide Quarterly Personal Computing Device Tracker preliminary results · Worldwide · 2024-Q3 |
| Q4 2024, Gartner | 64.4 million | desktop and laptop PCs (Windows, macOS, Chrome OS) shipped into channels worldwide, Gartner preliminary estimate · Worldwide · 2024-Q4 |
| Q4 2024, IDC | 68.9 million | traditional PCs (desktops, notebooks, workstations; no tablets or x86 servers) shipped worldwide, IDC Worldwide Quarterly Personal Computing Device Tracker preliminary results · Worldwide · 2024-Q4 |
| Q1 2025, Gartner | 58.9 million | desktop and laptop PCs (Windows, macOS, Chrome OS) shipped into channels worldwide, Gartner preliminary estimate · Worldwide · 2025-Q1 |
| Q1 2025, IDC | 63.2 million | traditional PCs (desktops, notebooks, workstations; no tablets or x86 servers) shipped worldwide, IDC Worldwide Quarterly Personal Computing Device Tracker preliminary results · Worldwide · 2025-Q1 |
| Q2 2025, Gartner | 63.2 million | desktop and laptop PCs (Windows, macOS, Chrome OS) shipped into channels worldwide, Gartner preliminary estimate · Worldwide · 2025-Q2 |
| Q2 2025, IDC | 68.4 million | traditional PCs (desktops, notebooks, workstations; no tablets or x86 servers) shipped worldwide, IDC Worldwide Quarterly Personal Computing Device Tracker preliminary results · Worldwide · 2025-Q2 |
| Quarter and firm | Units | Scope |
|---|---|---|
| Q2 2025, Omdia | 67.6 million | desktops, notebooks and workstations shipped worldwide, Omdia (incorporating Canalys) sell-in estimate · Worldwide · 2025-Q2 |
| Q3 2025, Omdia | 72.0 million | desktops, notebooks and workstations shipped worldwide, Omdia (incorporating Canalys) sell-in estimate · Worldwide · 2025-Q3 |
| Q4 2025, Omdia | 74.0 million | desktops, notebooks and workstations shipped worldwide, Omdia (incorporating Canalys) sell-in estimate · Worldwide · 2025-Q4 |
| Q1 2026, Omdia | 64.8 million | desktops, notebooks and workstations shipped worldwide, Omdia (incorporating Canalys) sell-in estimate · Worldwide · 2026-Q1 |
| Q2 2026, Omdia | 65.7 million | desktops, notebooks and workstations shipped worldwide, Omdia (incorporating Canalys) sell-in estimate · Worldwide · 2026-Q2 |
| Q3 2026, Omdia | 58.1 million | desktops, notebooks and workstations shipped worldwide, Omdia (incorporating Canalys) sell-in estimate · Worldwide · 2026-Q3 |
| Year and firm | Units | Scope |
|---|---|---|
| 2023, Gartner | 241.8 million | desktop and laptop PCs (Windows, macOS, Chrome OS) shipped into channels worldwide, Gartner preliminary estimate · Worldwide · 2023 |
| 2023, IDC | 259.5 million | traditional PCs (desktops, notebooks, workstations; no tablets or x86 servers) shipped worldwide, IDC Worldwide Quarterly Personal Computing Device Tracker preliminary results · Worldwide · 2023 |
| 2024, Gartner | 245.3 million | desktop and laptop PCs (Windows, macOS, Chrome OS) shipped into channels worldwide, Gartner preliminary estimate · Worldwide · 2024 |
| 2024, IDC | 262.7 million | traditional PCs (desktops, notebooks, workstations; no tablets or x86 servers) shipped worldwide, IDC Worldwide Quarterly Personal Computing Device Tracker preliminary results · Worldwide · 2024 |
| 2025, Gartner | 270.2 million | desktop and laptop PCs (Windows, macOS, Chrome OS) shipped into channels worldwide, Gartner preliminary estimate · Worldwide · 2025 |
| 2025, IDC | 284.7 million | traditional PCs (desktops, notebooks, workstations; no tablets or x86 servers) shipped worldwide, IDC Worldwide Quarterly Personal Computing Device Tracker preliminary results · Worldwide · 2025 |
| 2025, Omdia | 278.7 million | desktops, notebooks and workstations shipped worldwide, Omdia (incorporating Canalys) sell-in estimate · Worldwide · 2025 |

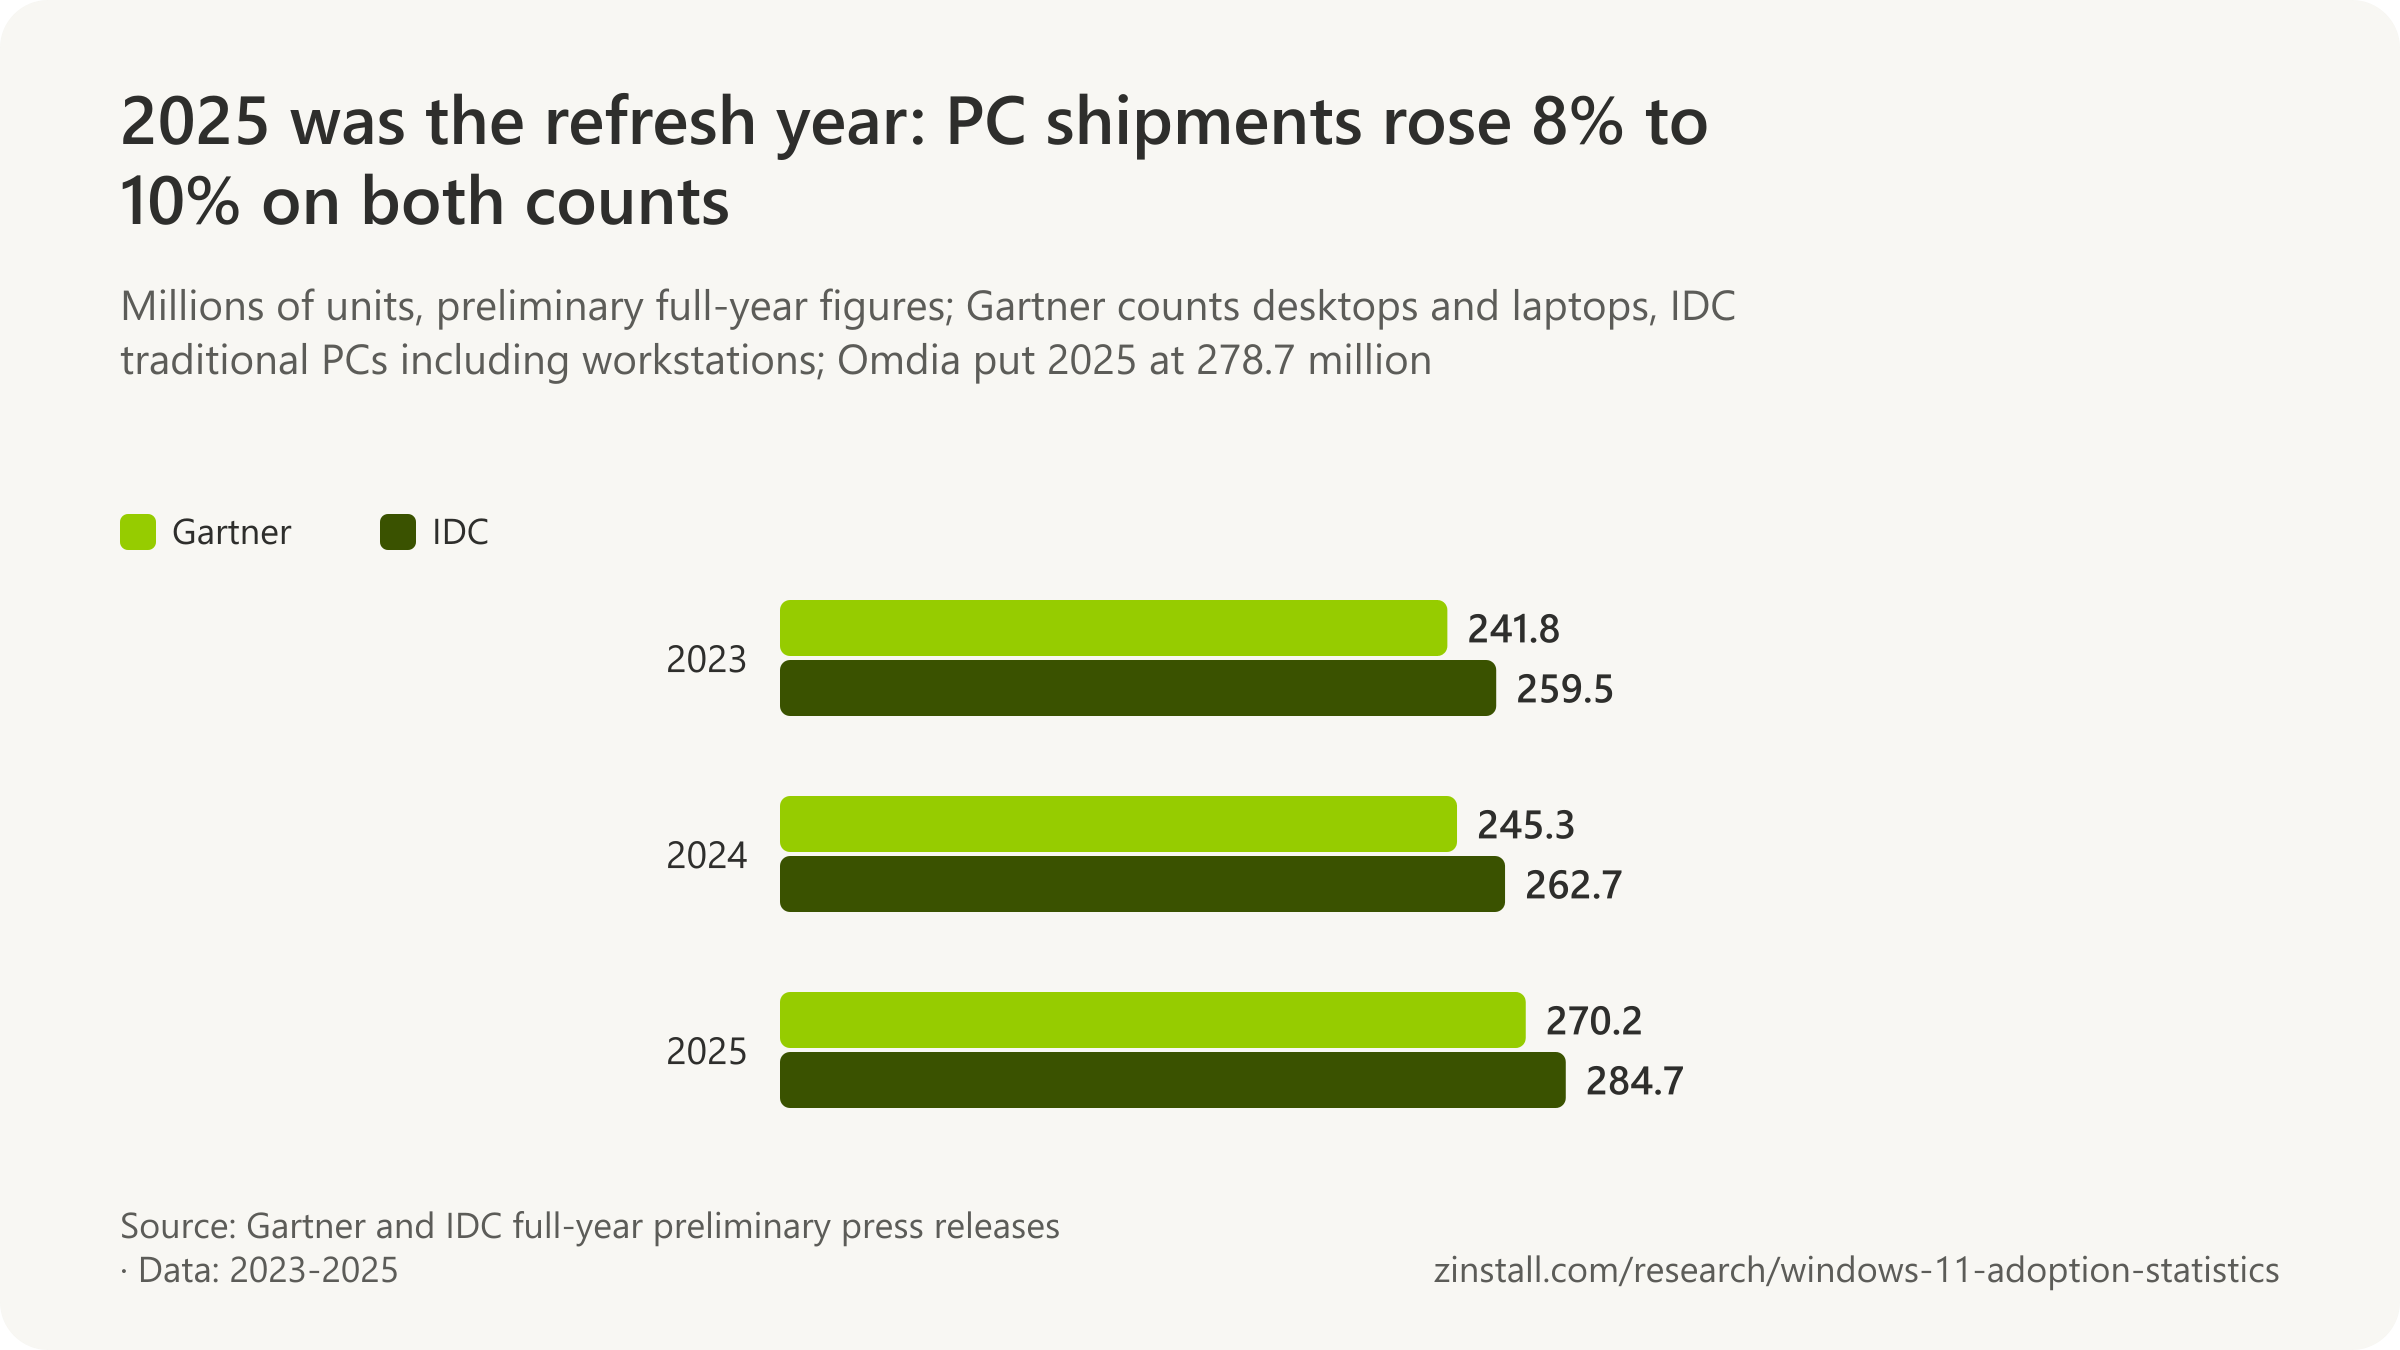
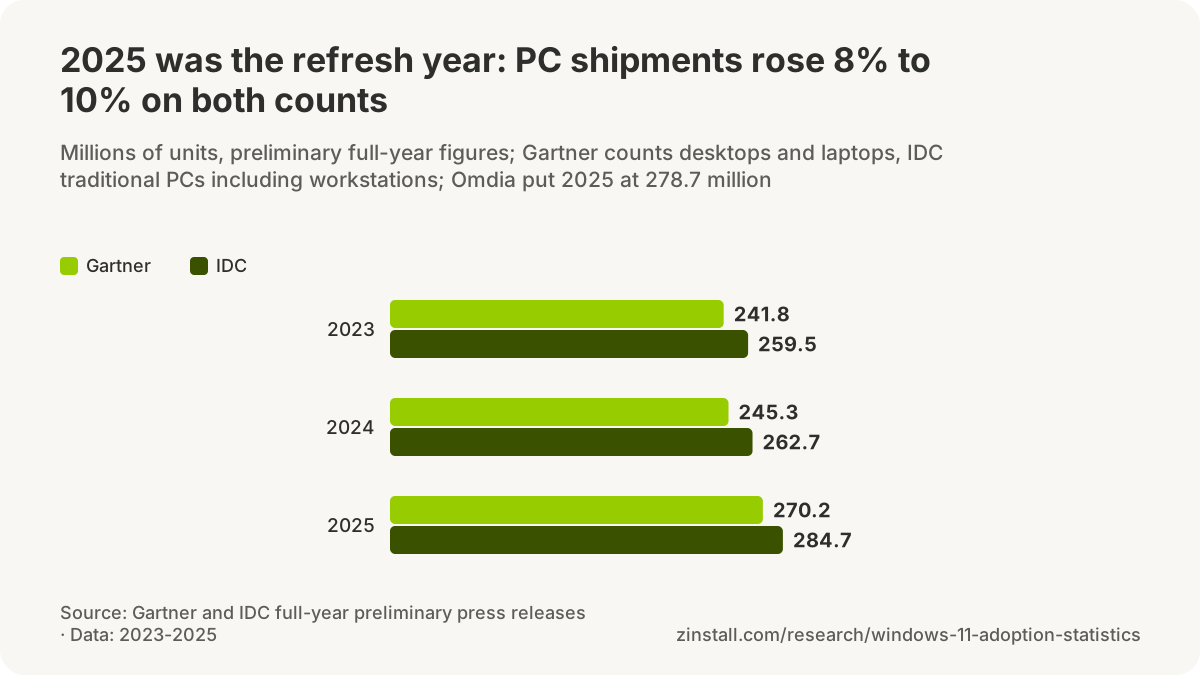
E-waste
- 1.6 billion pounds of electronic waste could result from the end of Windows 10 support, PIRG estimated in September 2025 (PIRG, 2025).
- Ending Windows 10 support could eventually lead to 700 million kg of electrical waste, against 62 billion kg of e-waste produced globally each year, according to the Restart Project (The Restart Project, 2025).
- Up to 250 million devices could become e-waste because of the end of Windows 10 support, the End of 10 campaign claimed at its launch in May 2025, a rounding of the Canalys December 2023 estimate (End of 10, 2025).
- 62 billion kg of e-waste was generated worldwide in 2022, a record, equivalent to 7.8 kg per person (Global E-waste Monitor, 2024).
- 22.3% of the world's e-waste (13.8 billion kg) was documented as formally collected and recycled in an environmentally sound manner in 2022 (Global E-waste Monitor, 2024).
- 5 billion kg of e-waste in 2022 came from small IT and telecommunication equipment, the category that includes personal computers, phones, routers and printers (Global E-waste Monitor, 2024).
- 82 billion kg of e-waste is projected to be generated in 2030, with the documented collection and recycling rate falling to 20% under business as usual (Global E-waste Monitor, 2024).
- 72.0% of UK adults surveyed in September 2025 were unaware that under the WEEE directive a retailer must help dispose of an old computer when selling a new one (Which?, 2025).
- 95% or more of laptop and desktop computers bought since the start of 2019 and owned for no more than five years were still in use in early 2025, per a Consumer Reports survey of 100,606 members (Consumer Reports, 2025).
- A refurbisher quoted by Back Market in 2025 warned that when Windows 10 devices reach their lowest price they become too cheap to work with, leaving no margin for refurbishment (Back Market, 2025).
- Microsoft pointed Windows 10 users to trade-in and recycling programs run by Acer, ASUS, Dell, HP, Lenovo, Samsung and retailers such as Best Buy, Costco and Currys, plus the Microsoft Store's online trade-in, in June 2025 (Microsoft, 2025).
- 700 million kilograms or more of e-waste could be generated by computers discarded at Windows 10's end of support, Right to Repair Europe estimated in September 2025 (Right to Repair Europe, 2025).
- 22% of small IT and telecommunication equipment e-waste (laptops, phones, routers) was documented as formally collected and recycled in 2022 (Global E-waste Monitor, 2024).
- E-waste generation rose almost five times faster than documented formal recycling between 2010 and 2022: generation grew by 2.3 billion kg a year on average, recycling by 0.5 billion kg a year (Global E-waste Monitor, 2024).
- USD 62 billion worth of recoverable natural resources went unaccounted for in 2022 because less than a quarter of e-waste was documented as properly collected and recycled (ITU, 2024).
- 4.6 million tonnes of e-waste in 2022 was small IT and telecommunication equipment such as laptops and phones, with a 22% documented collection and recycling rate, per the UNITAR press release (UNITAR, 2024).
- 2.7 million tons of selected consumer electronics (including computer equipment) entered the US municipal waste stream in 2018, and 38.5% was recycled (US EPA, 2020).
- 2.37 million tons of televisions, computers, cell phones and hard-copy peripherals were discarded by US consumers and businesses in 2009, and about 25% were collected for recycling (US EPA, 2014).
- Microsoft's Windows 10 end-of-support page directs users to trade-in offers from Microsoft and retail partners or to a Microsoft-approved recycling program in their region when buying a new Windows 11 PC (Microsoft, 2025).
- Back Market, generating over $3.5 billion in annual gross merchandise value with 18 million customers across 17 markets, launched an 'Ugly Computer' and ChromeOS Flex partnership in May 2026 to give a second life to PCs affected by the Windows 10 end of support (Back Market, 2026).
The campaign to extend support
- 20,000 petition signatures asking Microsoft to extend Windows 10 support were delivered by PIRG on 24 October 2023, the first count in its campaign (PIRG, 2023).
- 16,334 citizens had signed PIRG's petition for continued free Windows 10 support by 1 October 2025, against 20,000 'signatures' PIRG reported in October 2023 under a different count (PIRG, 2025).
- 590 businesses, elected officials and organizations signed PIRG's letter asking Microsoft to extend Windows 10 support, delivered 13 days before end of support (PIRG, 2025).
- 43,000 or more citizens signed the French non-profit HOP's petition against the end of free Windows 10 support, per PIRG's October 2025 release (PIRG, 2025).
- Euroconsumers' press release of 22 September 2025 gives the original consumer ESU end date as 13 October 2026, when it announced Microsoft's free EEA option (Euroconsumers, 2025).
Sources: Gartner, Inc. (2023-2026); International Data Corporation (2023-2026); Omdia, incorporating Canalys (2025, 2026); Dell Technologies; HP Inc.; Lenovo Group (2025, 2026); IDC; TrendForce (2026); Canalys; U.S. PIRG (2023, 2025); The Restart Project; End of 10 campaign; UNITAR and ITU; Which?; Consumer Reports; Back Market (2025, 2026); Microsoft (2025); Right to Repair Europe; International Telecommunication Union; United Nations Institute for Training and Research; US Environmental Protection Agency (2014, 2020); Euroconsumers
Data. All 831 statistics on this page, each with its source, verbatim quote and locator: CSV · JSON. Charts and figures on this page may be reused with a link to https://www.zinstall.com/research/windows-11-adoption-statistics as the source. Original publishers retain attribution.
Data behind each chart (CSV, 19 files)
- Windows 11 passed Windows 10 on desktop in mid-2025 and kept climbing
- Gamers moved to Windows 11 a year before everyone else
- Windows 11's share by country runs from more than four in five page views to under half
- A quarter of UK Windows 10 users planned to keep it unsupported
- PC shipments grew through most of 2024 and 2025 on the Windows 11 refresh, then memory prices ended the run
- Microsoft's own count: 1.4 billion for three years, then 1.6 billion
- Business fleets started late and caught up: Windows 11 in Lansweeper's audits
- Windows 7 fell from 12% to under 1% of desktop Windows in four years
- The United Kingdom crossed to Windows 11 in January 2025, India a year later, Russia only in May 2026
- 2025 was the refresh year: PC shipments rose 8% to 10% on both counts
- Windows 10's remaining share ran from over a quarter to a sixth, depending on who counts
- Windows 11's share doubled from December 2024 to September 2026, across Windows 10's end of support
- Windows 11 has four in five Windows page views in the UK and US, but barely half in China
- Estimates of PCs that cannot run Windows 11 grew from 240 million to 500 million
- Windows 10 security updates cost consumers $30 once and businesses $61 to $244 a year
- Windows 7 fell from 13% to half a percent of desktop Windows in five years
- Across four surveys from Windows 7 to Windows 11, 38% to 77% of IT respondents reported application compatibility problems or challenges
- Microsoft patched 1,130 vulnerabilities across its products in 2025; Windows 10 PCs not enrolled in ESU stopped getting fixes in October
- PC shipments climbed through 2025 on the Windows 11 refresh, then fell sharply in the third quarter of 2026 as memory prices rose
Methodology
What we included. This page collects Windows version shares from the public trackers (StatCounter and Valve's Steam survey, including archived monthly pages), fleet audits and telemetry (Lansweeper, ControlUp, Action1, Nexthink, Kaspersky, TeamViewer), installed-base and eligibility estimates (Microsoft, Dell, HP, Canalys, Omdia, PIRG, Consumer Reports, Euroconsumers), consumer and business surveys (Which?, ESET, vzbv, Nork Research, Restart Project), Microsoft's lifecycle and Extended Security Updates pages, application-compatibility figures (Microsoft App Assure, Cloudhouse, Panasonic, Symantec) and PC shipment releases (Gartner, IDC, Omdia). Official statistics, the trackers' own publications, company filings and transcripts, and peer-reviewed or analyst reports are preferred; vendor surveys and news reports are included only where no better source exists and are labelled as such in the dataset.
How each figure was verified. Every record carries the exact sentence or table cell from the source (the quote) and where it sits (the locator). A researcher confirmed each one against the source document; a script then re-fetched every source on October 12, 2026 and checked for the quote. Records the script could not confirm are kept only if the researcher's check was complete, and are marked for human review in the dataset. Restatements (a later outlet quoting an earlier figure) are recorded as restatements, with the primary figure alongside.
What we excluded. Figures we could not trace to a document, roundup pages that restate a tracker without a date, content-farm claims, figures that mix a page-view share with a device count, and enrolment numbers Microsoft has not published. Gartner's, PIRG's, Canalys's and several other publishers' pages refuse automated re-fetching; their records rest on the researcher's fetch and a saved copy, and are marked for human review in the dataset. Where a source gives a figure only in a form we could not confirm (for example, a chart with no data table), the record is marked unverified and is not exported.
Rounding and derivation. Numbers are reproduced as published. Where a tracker publishes two decimals, statements and table cells give one decimal, rounded half up, and the dataset keeps the published value. In the short sentences at the top of the page and of each section, large counts and money amounts may be rounded to two or three significant figures; the exact figure follows in the section's full statements and in the dataset. Derived figures (a change between two months, a share computed from two counts) say so and name their inputs. The bold figure in each statement is a reading aid, not an edit.
Updates. Sources are re-checked and new figures added quarterly, with the monthly tracker series topped up as they are published; the next scheduled refresh is January 2027, with the StatCounter and Steam series topped up each month as they are published. Corrections are welcome through the contact page.
Shares are reproduced as each tracker publishes them, rounded to one decimal in statements and tables; shares under one percent keep two decimals. StatCounter's figures are the values served on the retrieval date, which can differ from the figures first published; where that matters the page records both.
Cite this page
Zinstall. "Statistics on Windows 10 and Windows 11 Adoption: Who Upgraded, Who Can't, and What Happens Next." https://www.zinstall.com/research/windows-11-adoption-statistics. Updated 2026-10-14.
Frequently asked questions
What percentage of PCs run Windows 11?
On StatCounter, 71.4% of Windows desktop page views worldwide came from Windows 11 in September 2026 and 27.8% from Windows 10. Among gaming PCs in Valve's Steam survey the Windows 11 share was 71.3% the same month, and among managed business devices in Lansweeper's customer fleets it was 78.8% in July 2026, with 16.9% still on Windows 10. Each tracker counts a different population, so the figures are not interchangeable.
When did Windows 11 overtake Windows 10?
In July 2025 on StatCounter's worldwide desktop series, 45 months after Windows 11's launch, at 53.5% against 42.9%. Gamers crossed earlier: Windows 11 passed Windows 10 in the Steam survey in August 2024, at 49.2% against 47.1%. Managed business fleets crossed around mid-May 2025 in ControlUp's data. By country the crossover ranged from January 2025 in the United Kingdom to May 2026 in Russia and Indonesia.
How many PCs still run Windows 10?
No one publishes a count. The closest figures are Dell's description of a roughly 1.5 billion-unit installed base in November 2025 with about 500 million PCs capable of Windows 11 but not upgraded and another 500 million too old to run it, Microsoft's 1.6 billion monthly active Windows devices in April 2026 with no version split, and the trackers' shares: 27.8% of Windows desktop page views in September 2026 (StatCounter). Nationally, ESET counted about 21 million Windows 10 PCs in German private households in January 2026, and Which? estimated 21 million people using Windows 10 in the UK in September 2025.
How many PCs cannot upgrade to Windows 11?
The estimates measure different populations in different years: Canalys put it at 240 million PCs, roughly a fifth of those in use, in December 2023; PIRG at up to 400 million of about 1 billion Windows 10 devices in October 2023; Consumer Reports at 200 million to 400 million in September 2025; and Dell at about 500 million four-year-old machines in November 2025. Inside business fleets the remaining share is small: 11% of the endpoints not yet on Windows 11 needed full replacement in ControlUp's August 2024 sample, and by July 2026 only 2.8% of the Windows 10 devices left in Lansweeper's fleets failed the hardware requirements.
Which countries have the highest and lowest Windows 11 adoption?
Of the 26 countries on this page, the United Kingdom had the highest Windows 11 share of Windows desktop page views in September 2026 at 84.3%, followed by the United States at 80.5% and Australia at 80.5%; Russia had the lowest at 43.1%, with Indonesia at 46.7% and Egypt at 53.3%. Europe as a region stood at 74.5%, 3.1 points above the worldwide 71.4% (StatCounter).
How much do Windows 10 Extended Security Updates cost, and how long do they last?
Consumers can enrol a Windows 10 PC for a one-time $30 USD, by redeeming 1,000 Microsoft Rewards points, or at no cost by syncing PC settings; one licence covers up to 10 devices, and coverage, first set to end on 13 October 2026, was extended in June 2026 to 12 October 2027. Businesses pay $61 USD per device for the first year, with the price doubling each year for up to three years, to 10 October 2028; devices managed with Intune or Windows Autopatch pay $45 for the first year, schools pay $1, $2 and $4 per licence, and Windows 10 in Windows 365 or Azure Virtual Desktop is covered at no additional charge.
What are Windows 10 users doing now that support has ended?
In Which?'s September 2025 survey of UK adults using Windows 10, 26% intended to keep using it without updates, 39% to upgrade their existing device, 14% to replace the computer and 6% to switch to another operating system. In Germany, 34% of Windows 10 users surveyed by vzbv in November 2025 said they would keep using it without updates and 46% had switched or would switch to Windows 11. Among Japanese companies surveyed in August 2025, 32.5% planned to keep their PCs and change only the operating system, and 27.5% to buy new PCs.
Which sources should I cite for Windows 11 adoption statistics?
For consumer shares, StatCounter's Windows version pages (page views, monthly, by country) and Valve's Steam Hardware Survey (gaming PCs, monthly). For business fleets, Lansweeper's and ControlUp's published audits. For the installed base and eligibility, Microsoft's earnings statements, Dell's earnings-call transcript and Microsoft's Windows 11 requirements page. For dates and prices, Microsoft's lifecycle and Extended Security Updates pages. For what users plan, the Which? and vzbv surveys. For the PC market, Gartner's and IDC's quarterly releases. Every figure on this page links to the document it was taken from, with the verbatim quote in the dataset.
Sources: StatCounter (2025, 2026); Valve; Lansweeper; StatCounter Global Stats (2026); ControlUp (2024, 2025); Dell Technologies; Microsoft (2024, 2025, 2026); ESET Deutschland GmbH; Which?; Canalys; U.S. PIRG; Consumer Reports; Verbraucherzentrale Bundesverband; Nork Research Co., Ltd.; Gartner, Inc.
Ready to transfer your programs and files?
Sources
Every source document behind the figures on this page, listed by publisher. The sources line under each section links each publisher to its document, and the dataset carries the verbatim quote and locator for every statistic.
Show all 359 sources
Loading the list of sources. It is also published as a file: JSON.
guaranteeAny PC, any Windows Buy now