
Home › Research › Data Migration Failure Rates Without Zinstall (2026)
Research data
Data Migration Failure Rates (when done without Zinstall)
Where '83% of data migrations fail' comes from, what Bloor, Standish and other industry studies measured, and overrun rates for cloud, PC and server moves.
What these numbers measure. Migration projects across the industry, as measured by independent studies, surveys and audits; most of those projects relied on in-house approaches (three in four in Bloor Research's 2007 survey). None of these figures measures transfers made with Zinstall's products.
Key data migration statistics
Industry studies of migration projects; none of these figures measures Zinstall's products.
- 84% of Global 2000 companies' data migration projects ran over time or over budget, in an industry survey (2007).
- The earliest appearance of the 83% is a March 2005 trade-magazine interview with a vendor's CEO, 'according to Gartner', naming no document.
- Only 8% of companies that completed an SAP S/4HANA migration did so on schedule, and projects ran 30% longer than planned (2025).
- Cloud buyers estimated 29% of their public cloud spend was wasted in 2026, the first rise in five years.
- 32% of organisations in an industry survey had lost data while moving between devices or upgrading an operating system (2016).
- 20.9% of Windows Server instances audited five weeks before Server 2012's end of support were still running it, in 2023.
- Deploying one PC with an organisation's own process cost $615 on average, including IT labour, logistics and lost user time, in vendor-sponsored research (2012).
- 1 in 6 IT projects was a 'black swan' with a 200% average cost overrun, in a study of 1,471 projects (2011).
Sources: Bloor Research; CXO magazine; CIO; Flexera; Kroll Ontrack; Techzine; IDC; Harvard Business Review
Ask how often data migrations fail and the answer comes back the same from every vendor blog and every AI assistant: a share in the eighties, attributed to Gartner. This page traces that figure to its earliest appearance, lays out what the surveys that actually measured data migration projects found, and puts beside them the measured rates for cloud moves, PC and operating-system upgrades, server, database and website migrations, each with its population, sample and year. The surveys do not share a definition of failure, over budget, over time, cancelled or merely disappointing, and the page says so wherever it matters. Every figure here is an industry-wide measurement by an independent study, survey or audit; none of them measures transfers made with Zinstall's products.
What is the data migration failure rate?
Industry studies of migration projects; none of these figures measures Zinstall's products.
84% of Global 2000 companies' data migration projects ran over time or over budget, in an industry survey (Bloor Research, 2007).

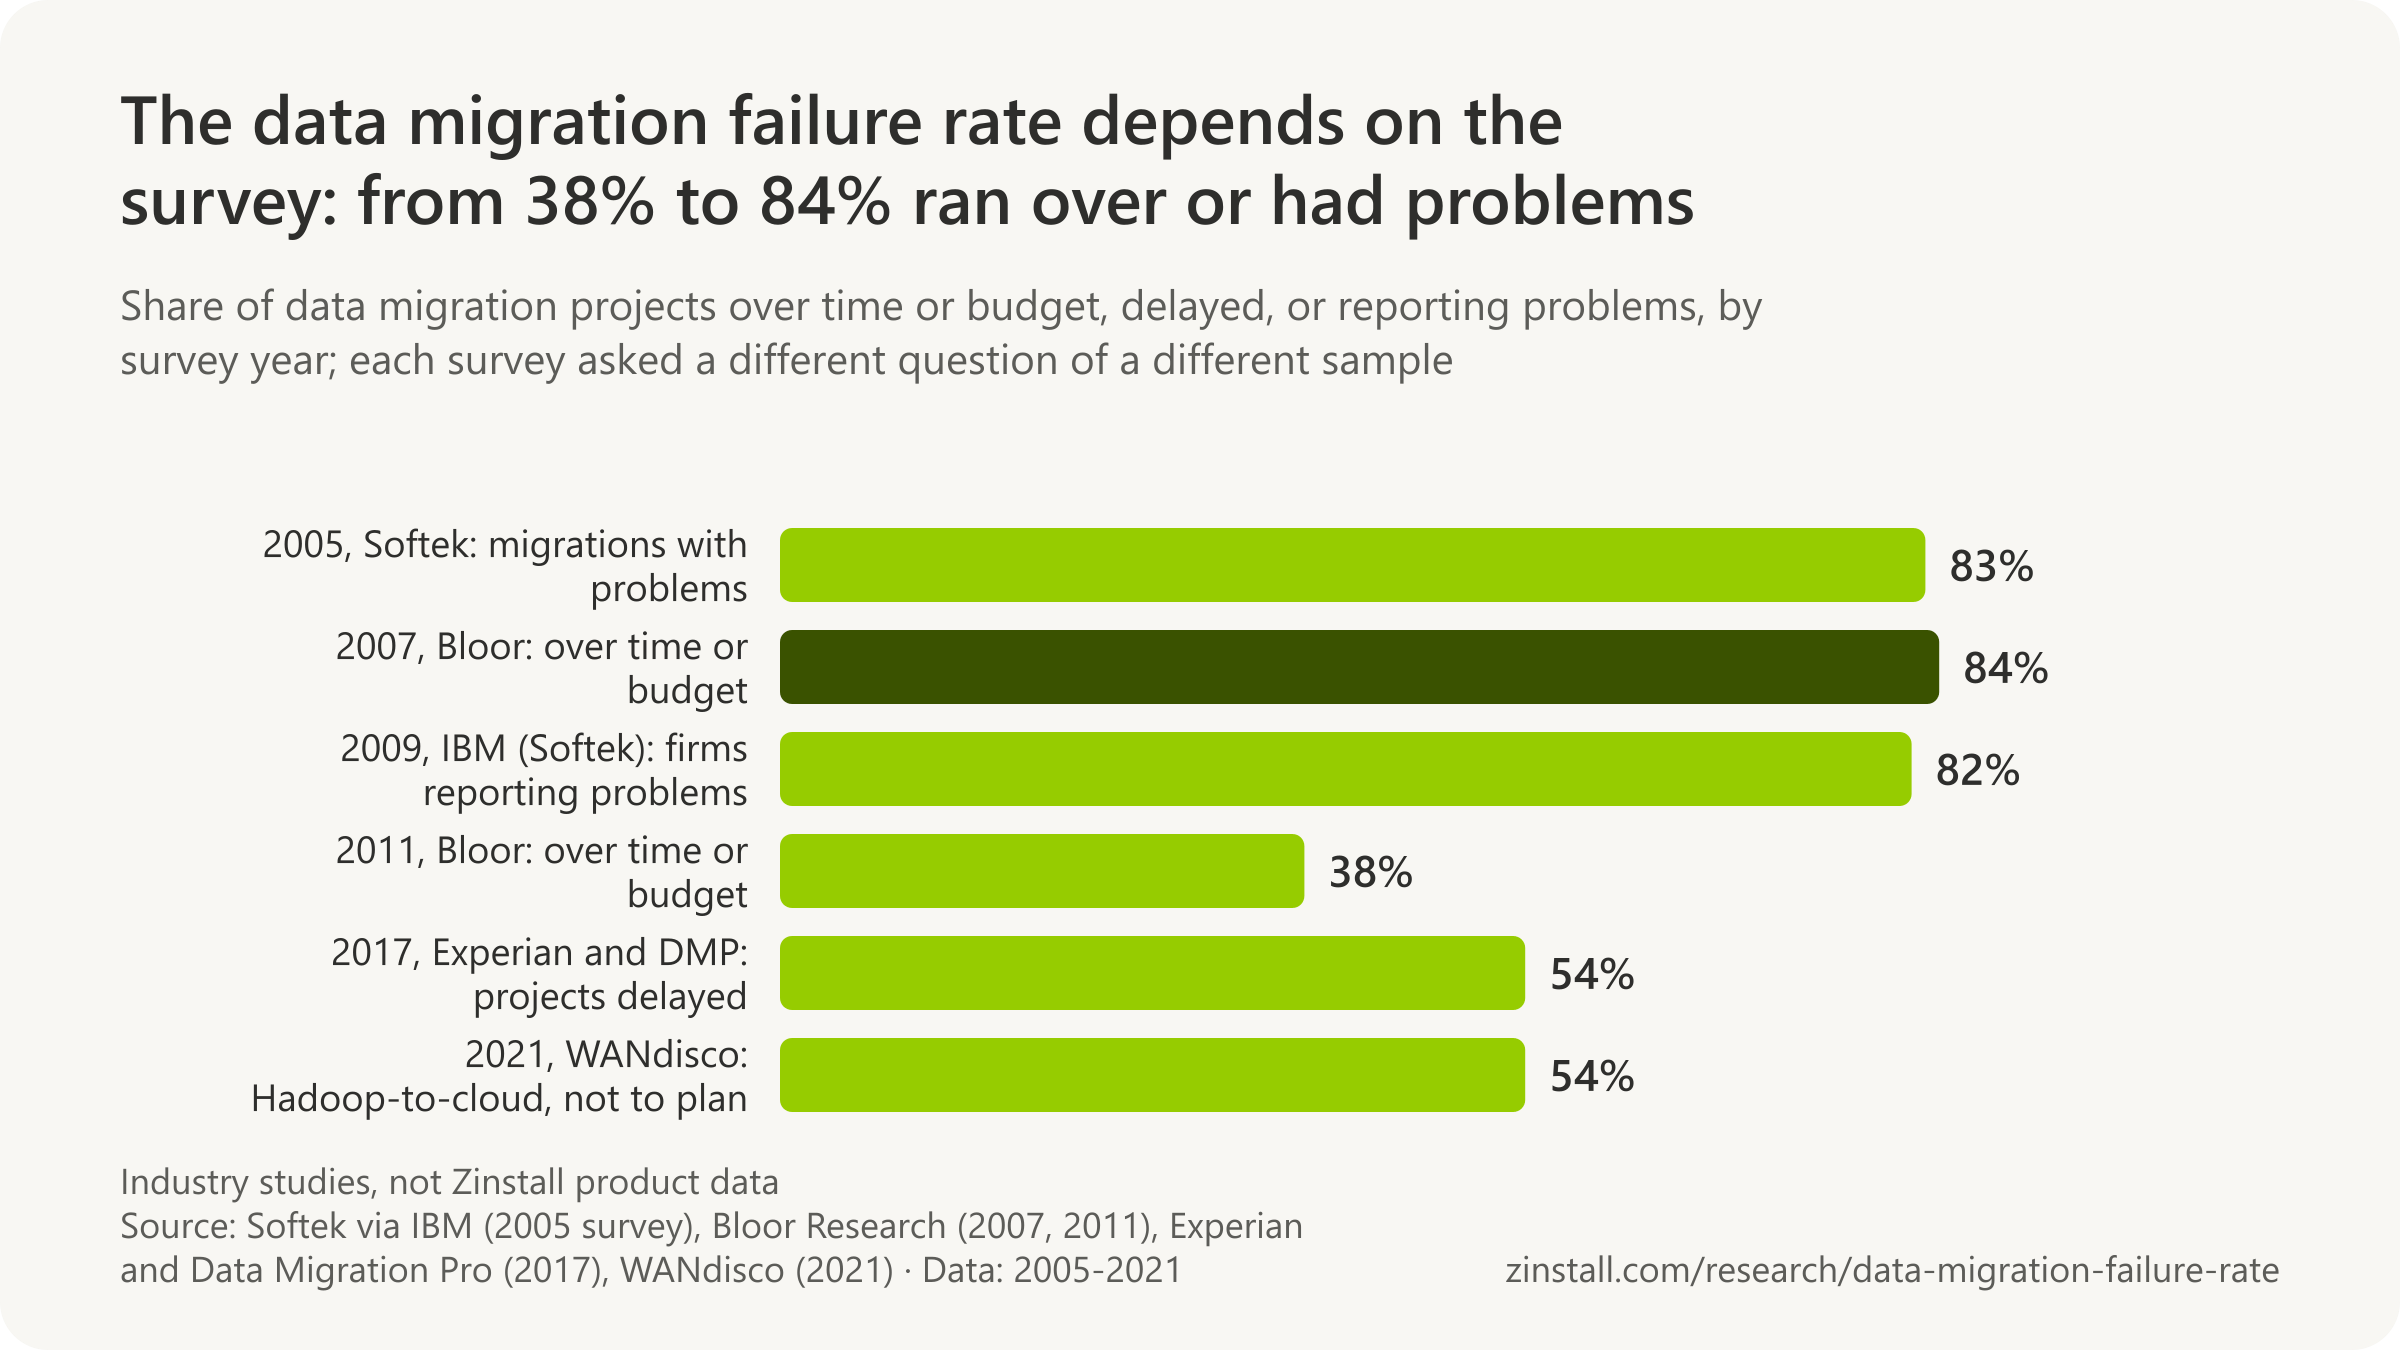
- A second survey in 2011, on a broader sample, found 38% of projects over time or over budget.
- Only 16% of the projects in the 2007 survey finished on time and on budget.
- Only 8% of companies that completed an SAP S/4HANA migration did so on schedule, and projects ran 30% longer than planned (Horvath, 2025).
- 36% of data migration projects kept to their original budget, in a 2017 study of practitioners.
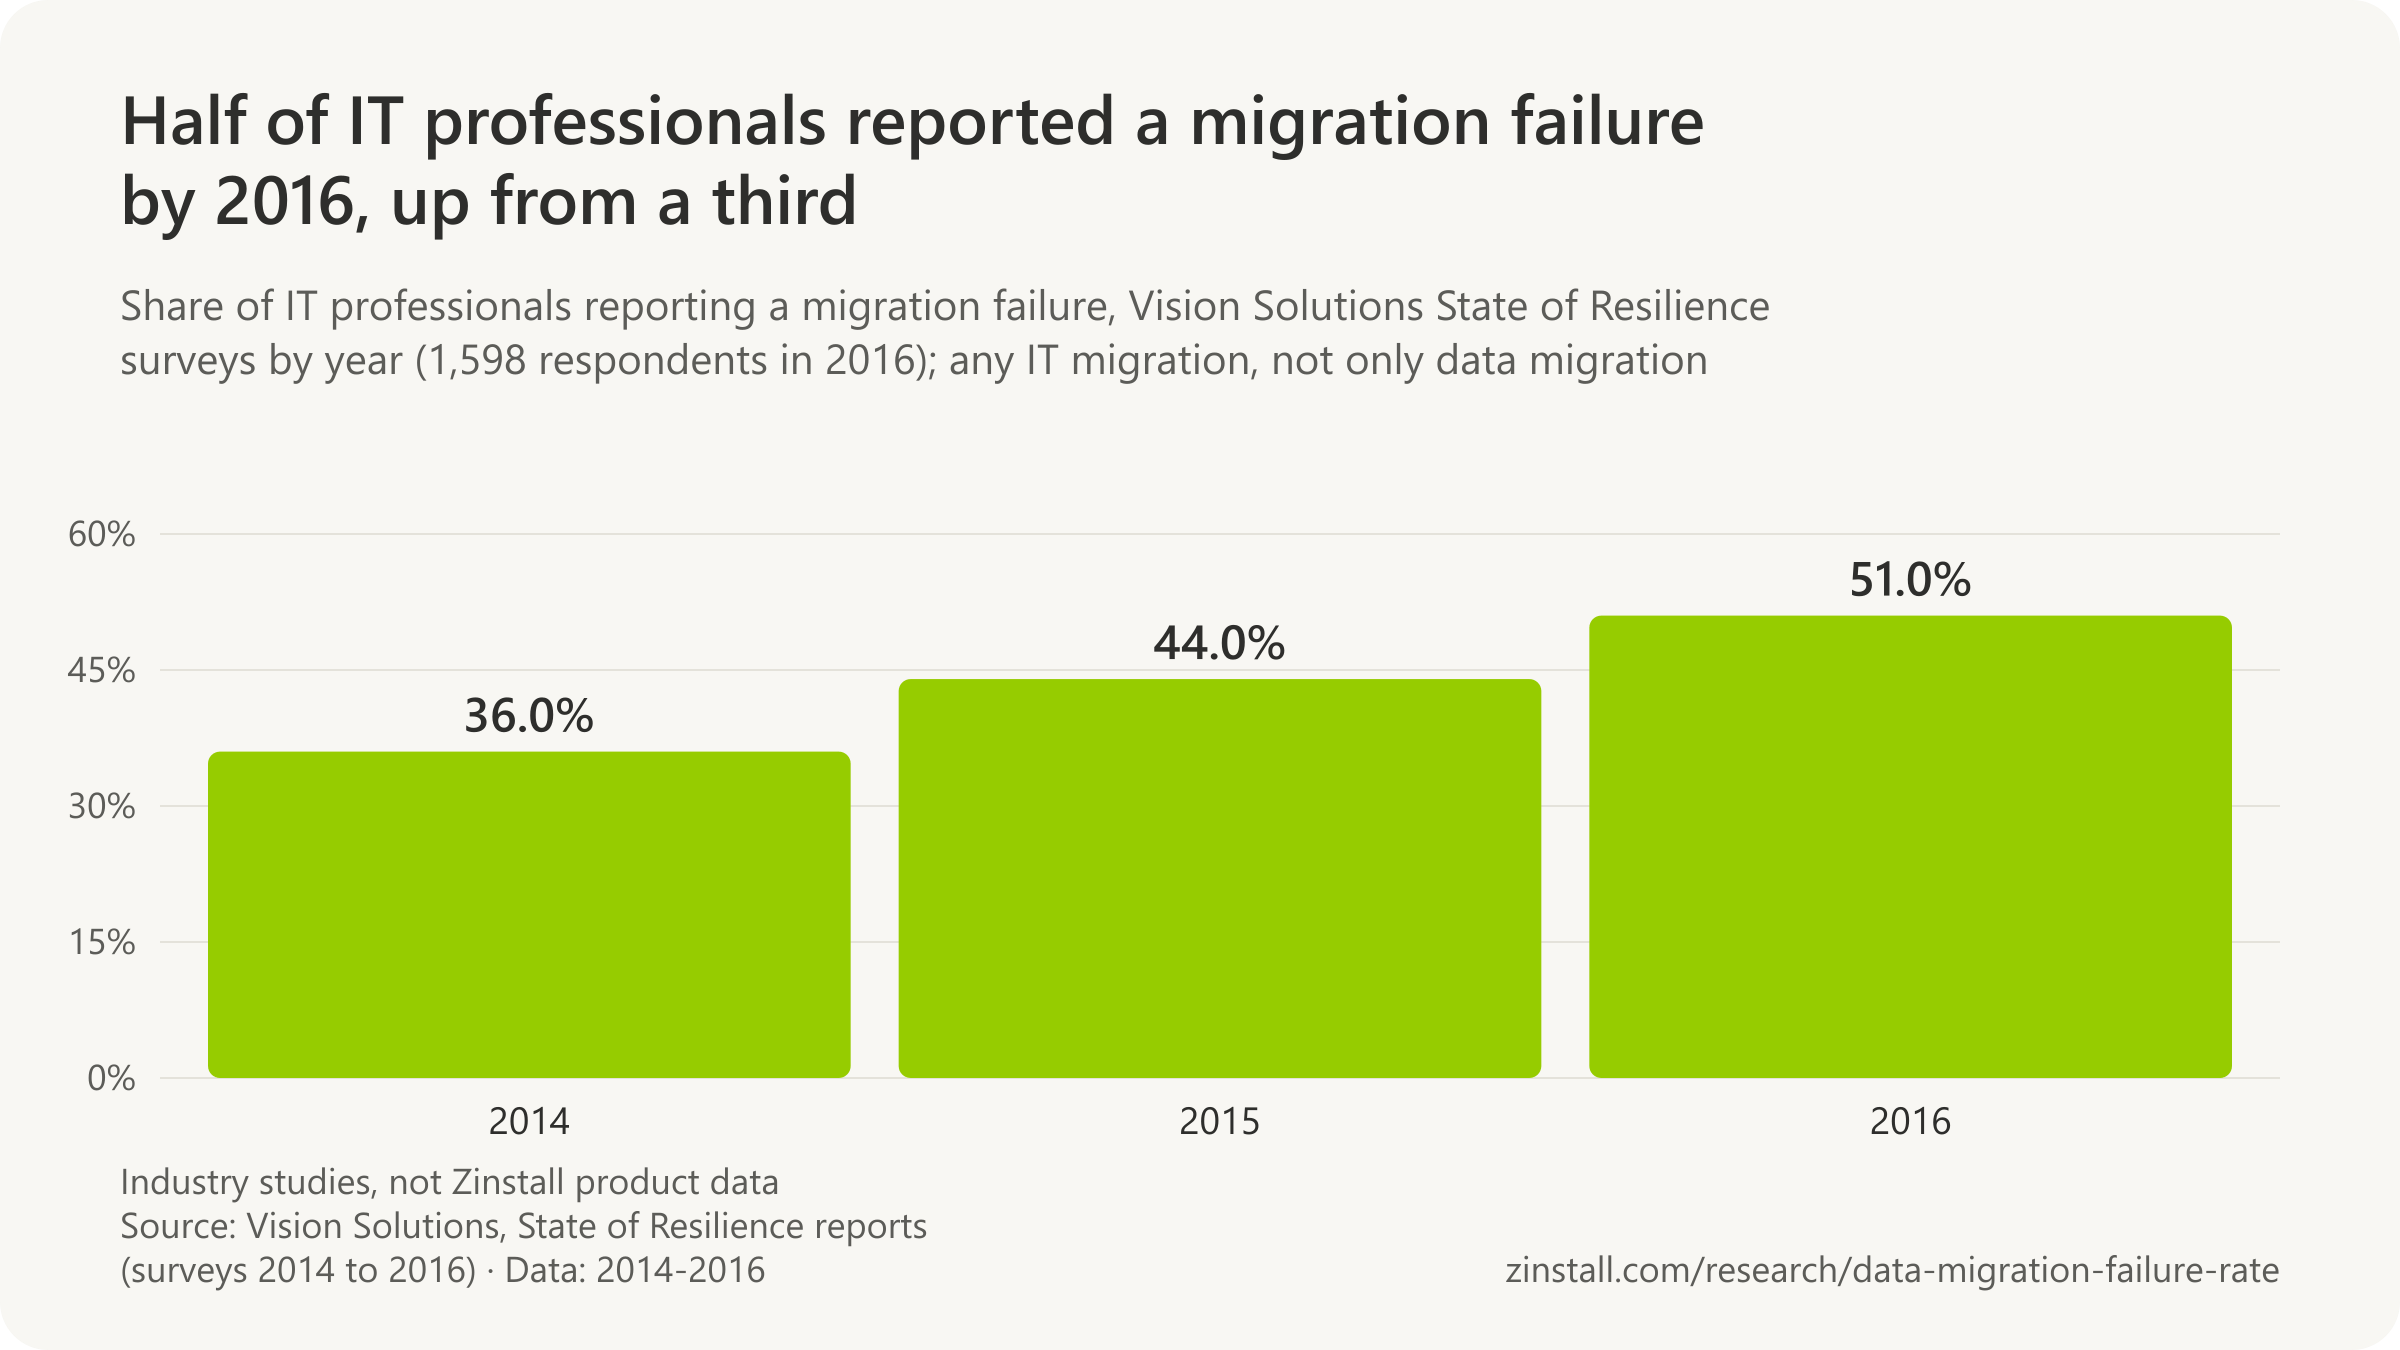
- 51% of IT professionals reported a migration failure of some kind in 2016, up from 36% in 2014.
| Year, survey and measure | Share |
|---|---|
| 1999, Standish Group as cited by Bloor Research (no document found): over time or budget, lower bound | over 80% |
| 2002, Information Architecture Team survey: median cost as a multiple of budget | 13.5x |
| 2005, Softek online study, preliminary results via Enterprise Systems Journal: migrations that had problems | about 75% |
| 2007, Bloor vendor-sponsored white paper, same month: with overruns, lower bound | over 60% |
| 2009, IBM (Softek) survey of 500 firms: reporting problems moving data | 82% |
| 2015, Bloor Research, undated research: on time and on budget | 2 in 3 |
| 2015, Vision Solutions survey of over 2,000 IT professionals: experienced a migration failure (any IT migration) | 44% |
| 2017, Experian and Data Migration Pro, 270 practitioners: suffered a delay | 54% |
| 2021, WANdisco and Unisphere, 216 data managers: Hadoop-to-cloud migrations not going to plan | 54% |
| 2026, ISG, 200 decision-makers: SAP migrations late and over budget | nearly 60% |
Sources: Bloor Research (2015, 2011, 2008, 2007); eWeek; CIO; Experian / Data Migration Pro; Vision Solutions; Information Architecture Team; Enterprise Systems Journal; IBM; Nextgov; IT Brief Australia; The Register; IBM Global Technology Services
More statistics (55)
84% of data migration projects ran over time or over budget among the Global 2000 organisations Bloor Research surveyed in 2007 (Bloor Research, 2007 survey as restated by Bloor in 2011).
No survey of data migration projects is large, recent and independent at once, so the honest answer is a range of surveys rather than a rate. The oldest measured figure that can still be read comes from Bloor Research, which asked large companies about projects with seven-figure budgets and found most of them late or over budget; its second survey four years later, of a different and wider set of organisations, found far fewer. Later surveys by Experian, by vendors and by consultancies asked narrower questions about particular kinds of migration, from Hadoop clusters to SAP systems, and each defines failure in its own way: a missed date, a blown budget, a cancelled project or a system that works but disappoints. The table keeps every definition next to its figure.
- 38% of data migration projects ran over time or over budget among organisations Bloor Research surveyed in spring 2011, against 84% in its 2007 survey (Bloor Research, 2011).
- 16% of data migration projects were completed on time and on budget in Bloor Research's 2007 survey of 43 Forbes Global 2000 companies, as reported by eWeek (eWeek citing Bloor Research, 2007).
- 43 Forbes Global 2000 companies responded to Bloor Research's 2007 data migration survey, according to eWeek's report of the study (eWeek, 2007).
- More than 60% of data migration projects had overruns on time and/or budget according to Bloor Research's 2007 data migration white paper (Bloor Research, 2007).
- Bloor Research's 2007 data migration survey covered only Global 2000 companies whose whole application project was budgeted at $1 million or more (Bloor Research, 2007).
- Bloor Research's second data migration survey was conducted in spring 2011 and was not limited to the Global 2000, unlike its 2007 survey (Bloor Research, 2011).
- 36% of data migration projects kept to their original planned budget in the Experian and Data Migration Pro study of 270 practitioners in 2017 (Experian / Data Migration Pro, 2017).
- 54% of data migration projects suffered some sort of project delay in the Experian and Data Migration Pro study of 270 practitioners in 2017 (Experian / Data Migration Pro, 2017).
- 270 international respondents took part in the Experian and Data Migration Pro Data Migration Research Study 2017, with a bias towards Data Migration Leads (Experian / Data Migration Pro, 2017).
- 8% of companies that had completed their SAP S/4HANA migration did so on schedule, and projects took 30% longer than planned on average, in Horvath's 2025 study of 200 SAP user companies (CIO citing Horvath, 2025).
- More than 6 in 10 SAP S/4HANA migrations exceeded their planned budget (significantly in a quarter of cases and in another 40%) in Horvath's 2025 study of 200 SAP user companies (CIO citing Horvath, 2025).
- 30% longer than originally planned was the average overrun of SAP S/4HANA migration projects in Horvath's 2025 study of 200 SAP user companies (CIO citing Horvath, 2025).
- Nearly 60% of SAP migration projects were delayed and over budget, as organisations under-estimated complexity, allowed scope expansion and misjudged internal constraints, in ISG's 2026 survey of 200 senior decision-makers at large companies (The Register citing ISG, 2026).
- 6% of IT leaders said their organisation completed its most challenging database migration on time, and 6% reported zero downtime, in Caylent's 2025 survey of over 300 IT leaders (Caylent, 2025).
- 46% of IT leaders experienced more than five hours of downtime during their most challenging database migration in Caylent's 2025 survey of over 300 IT leaders (Caylent, 2025).
- 57% of SAP customers and experts said data migration regularly delays SAP projects in Xmateria's 2026 survey of more than 100 respondents (SAPinsider citing Xmateria, 2026).
- 10% to 25% of projected time was the common overrun of SAP projects delayed by data migration, and nearly a third overran by up to 50%, in Xmateria's 2026 survey of more than 100 SAP customers and experts (SAPinsider citing Xmateria, 2026).
- 51% of IT professionals reported a migration failure in 2016, up from 44% in 2015 and 36% in 2014, in Vision Solutions' 2017 State of Resilience report of 1,598 IT professionals (Vision Solutions, 2017).
- 44% of organisations had experienced some form of IT migration failure according to Vision Solutions' 2016 State of Resilience report of more than 2,000 IT leaders, as reported by Nextgov (Nextgov citing Vision Solutions, 2016).
- 55% of IT professionals cited the inability to start applications on the new server in the required timeframe as the biggest reason for migration failure, followed by a lack of testing (38%), in Vision Solutions' 2016 State of Resilience report (ChannelInsider citing Vision Solutions, 2016).
- 54% of Hadoop-to-cloud data migration projects did not go according to plan (24% late, 11% over budget, 20% both) in WANdisco's 2021 benchmark survey of over 200 Global 2000 technical professionals (IT Brief citing WANdisco, 2021).
- 31% of Hadoop-to-cloud migration projects went over budget and 44% took longer than planned, while about a quarter were on time and on budget, in the 2021 Unisphere Research survey of 216 data managers sponsored by WANdisco (DBTA, 2021).
- 44% of Hadoop-to-cloud migration projects took longer than originally planned in the 2021 Unisphere Research survey of 216 data managers sponsored by WANdisco (DBTA, 2021).
- 13.5 times the budgeted amount was the median cost of a data migration project in the Information Architecture Team's 2002 survey of migration practitioners (IAT via KDnuggets, 2002).
- Only two-thirds of data migration projects are brought in on time and on budget according to Bloor Research's data migration technology page, updated in 2015 (Bloor Research, 2015).
- Almost 20% of SaaS deployment projects were cancelled over data migration problems, according to research cited on Bloor Research's data migration page in 2015 (Bloor Research, 2015).
- Over 50% of SaaS deployments had significant problems around data migration and almost 20% of such projects were cancelled, according to research cited on Bloor Research's data migration page in 2015 (Bloor Research, 2015).
- 39% of IT managers surveyed by ESG in 2005 said they perform a data migration weekly or monthly, Hitachi Data Systems' 2010 white paper says (Hitachi Data Systems, 2010).
- 75% of storage users experience problems with data migrations, including extended or unexpected downtime, Hitachi Vantara's storage migration page says, citing ESG research without a year (Hitachi Vantara, undated page accessed 2026).
- 82% of firms reported problems when moving data in Softek's 2005 Data Migration Study of 500 firms in North America and EMEA, an IBM Softek deck says (IBM, 2009).
- Bloor Research's 2007 data migration survey found that the Standish Group's 1999 figure of more than 80% of projects over time or budget had not changed (Bloor Research, 2008).
- Bloor Research's 2007 data migration white paper was sponsored by a number of companies active in the data migration market, while the 2007 survey was free to download (Bloor Research, 2007).
- Bloor Research's 2007 data migration white paper was described by the BCS data migration blog as the first white paper of its kind in the UK devoted to data migration by an independent analyst (BCS, 2007).
- Bloor Research's 2011 data migration report was kept behind a paid licence with restrictions on public comment because software vendors and integrators had not sponsored it, Johny Morris wrote on the BCS blog in 2011 (BCS, 2011).
- It was clear in Bloor Research's 2011 survey that data migration outcomes had improved since 2007, Bloor wrote in its Informatica-sponsored paper reviewing six years of its research (Bloor Research, 2013).
- The big result of Bloor Research's 2011 data migration survey was the extent to which adoption of technology increased the chance of success compared with its 2007 survey, Bloor wrote in 2013 (Bloor Research, 2013).
- Data migration projects have historically been prone to time and cost overruns and in some cases outright failures, Bloor Research wrote in its 2009 Celona-sponsored paper, naming three main risk factors (Bloor Research, 2009).
- 24% of Hadoop-to-cloud migration projects were not completed on time (and 20% missed both time and budget) in WANdisco's 2021 benchmark survey (IT Brief citing WANdisco, 2021).
- 11% of Hadoop-to-cloud migration projects were not within budget (budget only; a further 20% missed both time and budget) in WANdisco's 2021 benchmark survey (IT Brief citing WANdisco, 2021).
- 65% of companies identified severe to very severe quality deficiencies after completing their SAP S/4HANA migration in Horvath's 2025 study, citing scope expansion and under-estimated testing and data migration phases (CIO citing Horvath, 2025).
- 49% of organisations carried out little or no process re-engineering when moving to SAP S/4HANA, preserving legacy processes and data, and fewer than 1 in 5 reimplemented processes, in ISG's 2026 survey of 200 senior decision-makers (The Register citing ISG, 2026).
| Year, survey (sample) and measure | Share | Scope |
|---|---|---|
| 1999, Standish Group as cited by Bloor Research (no document found): over time or budget, lower bound | over 80% | Data migration projects in Standish Group research, 1999 (population, sample and definition not available: no Standish document located) · Worldwide · 1999 |
| 2002, Information Architecture Team survey: median cost as a multiple of budget | 13.5x | Respondents to the Information Architecture Team (IAT) ETL and data migration survey released November 2002 (preliminary results; sample size not stated) · Worldwide · 2002 |
| 2005, Softek online study, preliminary results via Enterprise Systems Journal: migrations that had problems | about 75% | 280 companies in the preliminary Softek survey · Worldwide · 2005 |
| 2005, the same Softek study of about 550 respondents, as IBM reported it in 2007: migrations that experienced problems | 83% | 700 end users surveyed by Softek with ESG, March 2005 · Worldwide · 2007 |
| 2007, Bloor Research survey of 43 Global 2000 companies: over time or budget | 84% | Data migration projects at Global 2000 organisations with a total project budget of $1m or more, surveyed by Bloor Research in 2007 · Worldwide · 2007 |
| 2007, the same Bloor survey via eWeek: on time and on budget | 16% | Data migration projects at Global 2000 organisations with a total project budget of $1m or more, surveyed by Bloor Research in 2007 · Worldwide · 2007 |
| 2007, Bloor vendor-sponsored white paper, same month: with overruns, lower bound | over 60% | Data migration projects at Global 2000 organisations with a total project budget of $1m or more, surveyed by Bloor Research in 2007 · Worldwide · 2007 |
| 2009, IBM (Softek) survey of 500 firms: reporting problems moving data | 82% | 500 firms in Softek's 2005 study · Worldwide · 2009 |
| 2011, Bloor Research survey, sample not published: over time or budget (provisional) | 38% | Data migration projects at organisations surveyed by Bloor Research in spring 2011 (not limited to the Global 2000); provisional figures · Worldwide · 2011 |
| 2015, Bloor Research, undated research: on time and on budget | 2 in 3 | Data migration projects, Bloor Research research summary (survey not named) · Worldwide · 2015 (page date; research undated) |
| 2015, Vision Solutions survey of over 2,000 IT professionals: experienced a migration failure (any IT migration) | 44% | More than 2,000 CTOs, CIOs and other IT leaders worldwide surveyed for Vision Solutions' 2016 State of Resilience report · Worldwide · 2015 (survey year; report 2016) |
| 2016, Vision Solutions survey of 1,598 IT professionals: experienced a migration failure (any IT migration) | 51% | 1,598 IT professionals who responded to Vision Solutions' global survey set, administered online between June and August 2016 (2017 State of Resilience report) · Worldwide · 2016 |
| 2017, Experian and Data Migration Pro, 270 practitioners: kept to the original budget | 36% | 270 data migration practitioners (mainly Data Migration Leads) from more than 30 countries, surveyed online by Data Migration Pro for Experian in April 2017 · Worldwide · 2017 |
| 2017, Experian and Data Migration Pro, 270 practitioners: suffered a delay | 54% | 270 data migration practitioners (mainly Data Migration Leads) from more than 30 countries, surveyed online by Data Migration Pro for Experian in April 2017 · Worldwide · 2017 |
| 2021, WANdisco and Unisphere, 216 data managers: Hadoop-to-cloud migrations not going to plan | 54% | Over 200 technical professionals from Global 2000 companies using Hadoop or having migrated Hadoop data lakes to the cloud, surveyed in May 2021 by Unisphere Research and Radiant Advisors for WANdisco · Worldwide · 2021 |
| 2021, the same WANdisco survey: completed migrations over time or budget | 55% | 216 data managers surveyed by Unisphere Research for WANdisco, 2021 · Worldwide · 2021 |
| 2021, the same WANdisco survey: not completed on time (time only) | 24% | Over 200 technical professionals from Global 2000 companies using Hadoop or having migrated Hadoop data lakes to the cloud, surveyed in May 2021 by Unisphere Research and Radiant Advisors for WANdisco · Worldwide · 2021 |
| 2021, the same WANdisco survey: not within budget (budget only; a further 20% missed both) | 11% | Over 200 technical professionals from Global 2000 companies using Hadoop or having migrated Hadoop data lakes to the cloud, surveyed in May 2021 by Unisphere Research and Radiant Advisors for WANdisco · Worldwide · 2021 |
| 2025, Horvath, 200 SAP-using companies: completed S/4HANA migrations finished on schedule | 8% | 200 SAP user companies with annual revenue of at least EUR 200 million and at least 200 employees in the DACH region, Northern and Eastern Europe and the US, interviewed by Horvath in Q1 2025 (37 had completed their S/4HANA migration) · Worldwide · 2025 |
| 2025, the same Horvath survey: S/4HANA migrations over budget, lower bound | over 60% | 200 SAP user companies with annual revenue of at least EUR 200 million and at least 200 employees in the DACH region, Northern and Eastern Europe and the US, interviewed by Horvath in Q1 2025 (37 had completed their S/4HANA migration) · Worldwide · 2025 |
| 2025, the same Horvath survey: severe quality deficiencies found after completion | 65% | 200 SAP user companies with annual revenue of at least EUR 200 million and at least 200 employees in the DACH region, Northern and Eastern Europe and the US, interviewed by Horvath in Q1 2025 (37 had completed their S/4HANA migration) · Worldwide · 2025 |
| 2025, Caylent, over 300 IT leaders: hardest database migration finished on time | 6% | Over 300 IT leaders (IT managers to CTOs, non-Caylent customers) across education, finance, entertainment, healthcare, manufacturing and utilities, surveyed for Caylent's 2025 Database Migration survey · Worldwide · 2025 |
| 2026, ISG, 200 decision-makers: SAP migrations late and over budget | nearly 60% | 200 senior decision-makers at large global organisations with 1,000 or more employees, interviewed by ISG for its 2026 State of SAP Migrations report · Worldwide · 2026 |
| 2026, Xmateria, over 100 respondents: data migration regularly delays SAP projects | 57% | More than 100 SAP customers and experts surveyed by data migration specialist Xmateria over six months (report published mid-2026) · Worldwide · 2026 |
| Survey year and measure | Figure | Scope |
|---|---|---|
| 2007: projects delivered by in-house teams (via Data Migration Pro) | 50% | Data migration projects at Global 2000 organisations with a total project budget of $1m or more, surveyed by Bloor Research in 2007 · Worldwide · 2007 |
| 2007: large application implementations a year at most large organisations | 4.5 a year | Data migration projects at Global 2000 organisations with a total project budget of $1m or more, surveyed by Bloor Research in 2007 · Worldwide · 2007 |
| 2007: migration methodologies developed in-house | most in-house | Data migration projects at Global 2000 organisations with a total project budget of $1m or more, surveyed by Bloor Research in 2007 · Worldwide · 2007 |
| 2011: data migration projects a year at the average respondent | about 6 a year | Data migration projects at organisations surveyed by Bloor Research in spring 2011 (not limited to the Global 2000) · Worldwide · 2011 |
| 2011: projects undertaken for legacy migration, the most cited reason | 27% | Data migration projects at organisations surveyed by Bloor Research in spring 2011 (not limited to the Global 2000); provisional figures · Worldwide · 2011 |
| 2011: projects involving data archival as well | 60% | Data migration projects at organisations surveyed by Bloor Research in spring 2011 (not limited to the Global 2000); provisional figures · Worldwide · 2011 |
| 2011: projects involving sensitive data | 44% | Data migration projects at organisations surveyed by Bloor Research in spring 2011 (not limited to the Global 2000); provisional figures · Worldwide · 2011 |
| 2011: projects migrating to the cloud | 5% | Data migration projects at organisations surveyed by Bloor Research in spring 2011 (not limited to the Global 2000); provisional figures · Worldwide · 2011 |
| 2011: projects run by software suppliers' own consultancies with no overruns (52% for pure-play implementers), via BCS | 59% vs 52% | Data migration projects in Bloor Research's 2011 survey, by type of implementer · Worldwide · 2011 |

Sources: Bloor Research (2007-2015); eWeek; Experian / Data Migration Pro (2017, 2018); CIO; The Register; Caylent; SAPinsider; Vision Solutions; Nextgov; ChannelInsider; IT Brief Australia; Database Trends and Applications; Information Architecture Team; Hitachi Data Systems; Hitachi Vantara; IBM; BCS (2007, 2011); Enterprise Systems Journal; IBM Global Technology Services; Data Migration Pro
Where does "83% of data migration projects fail" come from?
Industry studies of migration projects; none of these figures measures Zinstall's products.
The earliest appearance of the 83% is a March 2005 trade-magazine interview with a vendor's CEO, 'according to Gartner', naming no document (CXO magazine, 2005).
- The Gartner note later cited for the figure, from February 2009, contains 0 percentages in its public abstract.
- A 2005 Softek survey did find 83%, but of migrations that experienced problems, not of projects that failed.
- A 2014 Oracle brief carries the 83% under a Gartner label and 'more than 80%' under a Bloor label.
- One data-quality vendor cited Bloor's 38% in 2021, then replaced it with the 83% by 2025.
- The closest real Gartner figure is a 2005 forecast that more than 50% of data warehouse projects would see limited acceptance or fail.
| Gartner publication and subject | Figure |
|---|---|
| 2009, the same note: rise in client inquiries about data migration, 2008 over 2007 | 50%+ |
| 2001 press release: CRM implementations viewed as failures through 2006 (a forecast) | more than 50% |
| 2001, the same press release: margin by which most businesses would underestimate CRM project costs through 2006 (a forecast) | 40% to 75% |
| 2024 insight page: ERP initiatives failing to fully meet goals by 2027 (a forecast) | more than 70% |
| 2021 note: infrastructure and operations leaders encountering public cloud cost overruns through 2024 (a forecast) | 60% |
Sources: CXO magazine; Gartner (2001-2024); IBM Global Technology Services; Oracle and LumenData; Experian UK
More statistics (84)
83% of data migrations either fail outright or exceed their allotted budgets and implementation schedules 'according to Gartner', CXO magazine wrote in a March 2005 Q&A with Aradyme's CEO, the earliest dated appearance found, with no document (CXO magazine, 2005).
The sentence appears on vendor pages in three main wordings, attributed to Gartner, sometimes with a year and sometimes with the title of a Gartner note, never with a page number or a quotation. We traced it backwards through archived copies of the oldest pages that carry it. The earliest dated appearance we could find is an interview with the chief executive of a data migration vendor in a trade magazine in the spring of 2005, which names Gartner and no document. Every later page either cites nobody, cites another vendor page, or cites a 2009 Gartner research note whose public abstract contains no percentage and whose body, as quoted by three different consultancies, speaks of mixed results without a figure. Gartner did publish failure predictions in those years: about data warehouses, about CRM, later about ERP and cloud budgets, each a forecast rather than a measurement, and each with a different number. A storage vendor's 2005 survey found that eighty-three per cent of migrations had problems, which is the same figure in the same year measuring something else. The table lists every appearance we recorded; the methodology says what we searched.
- 83% of data migrations fail outright or exceed their allotted budgets and implementation schedules, a TU Munich lecture deck says, citing 'Gartner Group 2005' with no document, the earliest page found that puts a year on the claim (TU Munich, 2012).
- 83% of data migration projects either fail or exceed their budgets and schedules, Oracle and LumenData's 2014 brief says in a 'Did you know?' box labelled Gartner, with no document (Oracle and LumenData, 2014).
- 80%+ of data migration projects run over time and/or over budget, with cost overruns averaging 30% and time overruns 41%, Oracle and LumenData's 2014 brief says, labelled 'Bloor Group' with no document (Oracle and LumenData, 2014).
- 80%+ of projects involving data migration fail, Oracle and LumenData's 2014 brief says on its page 3, turning its own 'over time and/or over budget' sidebar into outright failure (Oracle and LumenData, 2014).
- 75% (up to) of new systems fail to meet expectations because of flaws in the migration process, Oracle's October 2011 'Successful Data Migration' white paper says, citing nobody; the paper carries no 83% (Oracle, 2011).
- 0 percentages appear in the public abstract of Gartner's research note on data migration risks, the note that later pages cite for the 83%, published 25 February 2009 (Gartner, 2009).
- 0 failure rates appear in the passage of Gartner's 2009 note that Hitachi, Ankura and Definian quote; it says data migrations meet with mixed results and that many efforts fail for lack of planning (Gartner, 2009).
- 0 failure rates are attached to Gartner's 2009 data migration note in Hitachi Data Systems' February 2010 white paper, the earliest document found that cites the note by ID (Hitachi Data Systems, 2010).
- 0 percentages appear in the Gartner passage Ankura quotes, with a footnote giving the note's title, date (25 Feb 2009) and gartner.com URL, in its data migration risk article (Ankura, 2022).
- 0 percentages appear in the Gartner passage Definian quotes with full citation (G00165710, February 2009) in its 'reasons data migrations fail' article; the note says many efforts fail for lack of planning (Definian, 2025).
- 50%+ of data warehouse projects would have limited acceptance or be outright failures through 2007 for lack of attention to data quality, Gartner's only dated 2005 failure forecast, which is about data warehouses, not data migrations (Gartner, 2005).
- 900+ companies in North America, Western Europe and the Pacific were the basis of Gartner's 2005 forecast that more than half of data warehouse projects would have limited acceptance or fail outright through 2007, InformationWeek reported (InformationWeek, 2005).
- 50%+ of business intelligence and CRM deployments would suffer limited acceptance or outright failure for lack of attention to data quality, an Informatica fact sheet says, citing Gartner and widening the 2005 data warehouse forecast (Informatica, 2006).
- 83% of data migrations experienced problems in Softek's March 2005 survey of 700 end users, run with Enterprise Strategy Group, unexpected downtime leading, the one dated 2005 '83% of migrations' figure found (IBM, 2007).
- 75% (about three-quarters) of the first 280 companies in Softek's 2005 data migration survey conceded having problems when migrating data, Enterprise Systems reported from the preliminary results (Enterprise Systems Journal, 2005).
- 82% of firms reported problems when moving data in Softek's 2005 Data Migration Study of 500 firms in North America and EMEA, an IBM Softek deck says (IBM, 2009).
- 550 respondents made up the Softek Migration Study of February 2005 according to an IBM France deck of October 2007, a third sample size for the same survey (IBM, 2007).
- 38% of data migration projects fail, Experian UK's 'eight hurdles' post said in 2021 citing Bloor's 2011 white paper; by 2025 the same URL says 83% citing Gartner's 2009 note (Experian UK, 2021).
- 83% of data migration projects either fail or exceed budgets and timelines, Experian UK's guide says, with a footnote naming Gartner's 'Risks and Challenges in Data Migrations and Conversions' but no date, ID or link (Experian UK, 2025).
- 83% failure rate for data migration projects is attributed to 'industry observers like Gartner' in QuerySurge's 2026 white paper, whose footnote 1 for the figure is QuerySurge's own data migration testing page (QuerySurge, 2026).
- 83% of migration projects either fail or run over budget and schedule 'in widely cited enterprise literature', Bridge Global says, citing QuerySurge's summary rather than Gartner (Bridge Global, 2026).
- 83%+ of data migration projects fail outright or exceed budget or schedule, DataMC's blog says citing Gartner, while putting Bloor Group's 'outright failure rate' at 38%, a figure Bloor reported as over time or budget (DataMC, 2021).
- 83% of data migration projects either fail outright or significantly exceed their budgets and timelines, Fourlane says citing Gartner, with 'Bloor Research puts the failure rate at roughly 75%' and 'only about 16% finish on time and on budget', none sourced (Fourlane, 2026).
- 83% of data migration projects either fail or overshoot their budgets, Syren Cloud says, calling it 'Gartner's 2024 study', a date no other appearance gives (Syren Cloud, 2025).
- 83% of data migrations either fail outright or exceed their allotted budgets and implementation schedules, Simplify Consulting's blog says, adding that Gartner 'recently stated' it, with no document (Simplify Consulting, 2019).
- 80% of data migration projects overran time, budget, both, or failed entirely in 'the much quoted' 1999 Standish Group report, and 84% in Bloor's report nearly ten years later, a BCS article says, naming neither document (BCS, 2008).
- An Informatica conference slide in 2008 presented migration failure and overrun results within a percentage point of Bloor Research's 2007 paper but credited them to a 1999 Standish Group survey, according to Bloor's Philip Howard (Bloor Research, 2008).
- 50% of data migration projects resulted in problems significantly affecting the business, Canonical's blog says, dating the Gartner research to 2019 with no document (Canonical, 2022).
- 50%+ of data migration endeavours would outstrip their planned budget and timeframe throughout 2022, Pimcore says Gartner found, with no document (Pimcore, 2024).
- $100 billion in wasted migration spend over three years (McKinsey) and '83% of data migration projects either fail outright or exceed their budgets and timelines' (attributed to Gartner) were restated together by Insentra in 2026 (Insentra, 2026).
- 84% of data migration activities failed to hit time or budget targets in Bloor Research's 2007 research, as restated by vendors Datanomic and Iergo at a London event reported by A-Team Insight in 2009 (A-Team Insight citing Bloor Research, 2009).
- 66% (less than two-thirds) of companies completed their data migration on time and within budget, with an average budget of $875,000 and average overrun of $268,000, a 2015 LinkedIn post says of a Bloor Research survey, naming no document (LinkedIn, 2015).
- 30% was the average cost overrun on data migration projects according to a figure the Oracle and LumenData brief attributes to 'Bloor Group' (Oracle/LumenData citing Bloor, 2014).
- 41% was the average time overrun on data migration projects according to a figure the Oracle and LumenData brief attributes to 'Bloor Group' (Oracle/LumenData citing Bloor, 2014).
- Half of all data migration projects fail to meet their objectives, with many abandoned after their budgets run out, according to an unsourced claim in Experian's 'Taking the pain out of data migration' paper landing page (Experian, 2017).
- 0 failure percentages accompany Gartner analyst Ted Friedman's 2008 advice on data migration quality in eWeek, which instead cites Bloor's September 2007 survey for 64% late and 37% over budget (eWeek, 2008).
- 30 multiple-choice questions made up Softek's online data migration study of January 2005, the survey whose problem rate was later reported as 83% of migrations (Softek, 2005).
- 50% (more than half) of all companies implementing CRM systems would view those implementations as failures through 2006, as KDnuggets restated Gartner's September 2001 forecast three days later (KDnuggets, 2001).
| Year, outlet and wording | Figure | Scope |
|---|---|---|
| 2005, CXO magazine, 2005: fail outright according to gartner | 83% | Data migration projects, population unstated · Worldwide · 2005 |
| 2008, BCS, The Chartered Institute for IT: standish 1999 80pct and bloor 84pct | 84% | Data migration projects, population unstated · Worldwide · 2008 |
| 2012, Technische Universitaet Muenchen: fail outright gartner group 2005 | 83% | Data migration projects, population unstated · Worldwide · 2012 |
| 2014, Oracle and LumenData: fail or exceed gartner | 83% | Data migration projects, population unstated · Worldwide · 2014 |
| 2014, Oracle and LumenData: bloor more than 80pct over time or budget | 80%+ | Data migration projects, population unstated · Worldwide · 2014 |
| 2014, Oracle and LumenData: fail as sobering statistic | 80%+ | Data migration projects, population unstated · Worldwide · 2014 |
| 2016, JMR Software via ITWeb: fail outright or cost overruns | 83% | Data migration projects, population unstated · Worldwide · 2016 |
| 2017, Experian Data Quality: every year no citation | 83% | Data migration projects, population unstated · Worldwide · 2017 |
| 2017, David Colella: fail or exceed | 83% | Data migration projects, population unstated · Worldwide · 2017 |
| 2017, Technologent: programs fall short of expectations | 83% | Data migration projects, population unstated · Worldwide · 2017 |
| 2019, Simplify Consulting: allotted budgets gartner recently | 83% | Data migration projects, population unstated · Worldwide · 2019 |
| 2019, Transitional Data Services: fail to meet expectations analyst report | 83% | Data migration projects, population unstated · Worldwide · 2019 |
| 2020, StorageReview: fail or exceed | 83% | Data migration projects, population unstated · Worldwide · 2020 |
| 2021, DataMC: and bloor 38pct outright failure | 83%+ | Data migration projects, population unstated · Worldwide · 2021 |
| 2021, TDWI: as gartner quotation | 83% | Data migration projects, population unstated · Worldwide · 2021 |
| 2021, Varonis: about 50pct exceed budgets or harm | about 50% | Data migration projects (Gartner prediction, as restated) · Worldwide · 2021 |
| 2022, Canonical: csa 90pct experienced failing cloud migration | 90% | Respondents to the CSA ERP and cloud adoption survey, as restated · Worldwide · 2022 |
| 2022, Canonical: 2019 50pct problems affecting business | 50% | Data migration projects (Gartner, as restated) · Worldwide · 2022 |
| 2022, Integrate.io: and bloor 80pct | 83% | Data migration projects, population unstated · Worldwide · 2022 |
| 2022, SyncMatters: fall short and bloor over 80pct | 83% | Data migration projects, population unstated · Worldwide · 2022 |
| 2023, Banken.nl: eight in ten migrations over budget | 8 in 10 | Data migration projects, population unstated · Worldwide · 2023 |
| 2023, Data Center Knowledge: study conducted by gartner | 83% | Data migration projects, population unstated · Worldwide · 2023 |
| 2023, Datafold: 83pct fail and over 80pct fail | 83% | Data migration projects, population unstated · Worldwide · 2023 |
| 2023, DatacenterDynamics: | 83% | Data migration projects, population unstated · Worldwide · 2023 |
| 2024, DEV Community: fail to meet expectations | 70% to 90% | Data migration projects, population unstated · Worldwide · 2024 |
| 2024, Hevo Data: fail or exceed | 83% | Data migration projects, population unstated · Worldwide · 2024 |
| 2024, Pimcore: 50pct throughout 2022 | 50%+ | Data migration initiatives (Gartner prediction, as restated) · Worldwide · 2024 |
| 2025, Brainhub: fail or exceed timing and budget | 83% | Data migration projects, population unstated · Worldwide · 2025 |
| 2025, Copia Wealth Studios: collapse and gartner half | 83% | Data migration projects, population unstated · Worldwide · 2025 |
| 2025, DataFlowMapper: 30 to 83pct range | 30% to 83% | Data migration projects, population unstated · Worldwide · 2025 |
| 2025, Experian UK: citing gartner 2009 note by title | 83% | Data migration projects, population unstated · Worldwide · 2025 |
| 2025, Glean: and 50pct and 90pct businesses fail | 83% | Data migration projects, population unstated · Worldwide · 2025 |
| 2025, GTconsult: fail outright | 83% | Data migration projects, population unstated · Worldwide · 2025 |
| 2025, NetApp: fail to deliver on time or over budget | 80%+ | Migrations, population unstated · Worldwide · 2025 |
| 2025, Quinnox: fail outright or exceed | 83% | Data migration projects, population unstated · Worldwide · 2025 |
| 2025, Quinnox: over 83pct dramatically exceed | 83%+ | Data migration projects, population unstated · Worldwide · 2025 |
| 2025, Quinnox: and oracle over 80pct | 83% | Data migration projects, population unstated · Worldwide · 2025 |
| 2025, RudderStack: fail no citation | 83% | Data migration projects, population unstated · Worldwide · 2025 |
| 2025, Syren Cloud: as gartner 2024 study | 83% | Data migration projects, population unstated · Worldwide · 2025 |
| 2025, MSH: fail or exceed | 83% | Data migration projects, population unstated · Worldwide · 2025 |
| 2026, Bridge Global: citing querysurge summary | 83% | Data migration projects, population unstated · Worldwide · 2026 |
| 2026, EnlightLab: fail blow budgets or disruption and over 80pct | 83% | Data migration projects, population unstated · Worldwide · 2026 |
| 2026, FileFeed: exceed and nearly 50pct fail outright | nearly 50% | Data migration projects, population unstated · Worldwide · 2026 |
| 2026, Fourlane: and bloor 75pct and 16pct on time | 83% | Data migration projects, population unstated · Worldwide · 2026 |
| 2026, Globema: citing oracle lumendata as gartner report | 83% | Data migration projects, population unstated · Worldwide · 2026 |
| 2026, Integrate.io: and bloor 80pct as quotations | 83% | Data migration projects, population unstated · Worldwide · 2026 |
| 2026, Ispirer: fail or exceed | 83% | Data migration projects, population unstated · Worldwide · 2026 |
| 2026, Kanerika: fail outright or exceed | 83% | Data migration projects, population unstated · Worldwide · 2026 |
| 2026, Kovair: fail outright or miss targets | 83% | Data migration projects, population unstated · Worldwide · 2026 |
| 2026, Ofima: erp | 83% | Data migration projects, population unstated · Worldwide · 2026 |
| 2026, Peliqan: gartner and oracle and 83pct | 80%+ | Data migration projects, population unstated · Worldwide · 2026 |
| 2026, QuerySurge: with self citation | 83% | Data migration projects, population unstated · Worldwide · 2026 |
| 2026, Symmetric Health Solutions: fail entirely | 83% | Data migration projects, population unstated · Worldwide · 2026 |
| 2026, The Virtual Forge: and over 50pct harm the business | 83% | Data migration projects, population unstated · Worldwide · 2026 |
| unda, Canonical: more than 50pct initiatives exceed budget | 50%+ | Data migration initiatives (Gartner prediction, as restated) · Worldwide · undated |
| Gartner publication and subject | Figure | Scope |
|---|---|---|
| 2005 press release: data warehouse projects with limited acceptance or outright failure through 2007 (a forecast, 900 companies studied) | 50%+ | Data warehouse projects (Gartner forecast; study of more than 900 companies per InformationWeek) · Worldwide · 2005 |
| 2009 research note 'Risks and Challenges in Data Migrations and Conversions' (Ted Friedman): percentages in the public abstract | 0 | Gartner clients (research note, paywalled) · Worldwide · 2009 |
| 2009, the same note: rise in client inquiries about data migration, 2008 over 2007 | 50%+ | Gartner client inquiries · Worldwide · 2009 |
| 2001 press release: CRM implementations viewed as failures through 2006 (a forecast) | more than 50% | All CRM implementations through 2006 (Gartner analyst forecast; no survey sample stated) · Worldwide · 2001-2006 |
| 2001, the same press release: margin by which most businesses would underestimate CRM project costs through 2006 (a forecast) | 40% to 75% | Businesses implementing CRM through 2006 (Gartner analyst forecast; no survey sample stated) · Worldwide · 2001-2006 |
| 2024 insight page: ERP initiatives failing to fully meet goals by 2027 (a forecast) | more than 70% | Recently implemented ERP initiatives (Gartner analyst forecast; no sample stated) · Worldwide · 2024-2027 |
| 2021 note: infrastructure and operations leaders encountering public cloud cost overruns through 2024 (a forecast) | 60% | Infrastructure and operations leaders (Gartner prediction, no survey) · Worldwide · 2021 (prediction through 2024) |
Sources: CXO magazine; Technische Universitaet Muenchen, Andreas Freitag; Oracle and LumenData; Oracle; Gartner (2001-2024); Hitachi Data Systems; Ankura; Definian; InformationWeek; Informatica; IBM Global Technology Services; Enterprise Systems Journal; IBM; IBM France; Experian UK (2021, 2025); QuerySurge; Bridge Global; DataMC; Fourlane; Syren Cloud; Simplify Consulting; BCS, The Chartered Institute for IT; Bloor Research; Canonical (2022, 2026); Pimcore; Insentra; A-Team Insight; Andy Abbas on LinkedIn; Oracle / LumenData; Experian Data Quality (2017); eWeek; Softek Storage Solutions; KDnuggets; JMR Software; David Colella on LinkedIn; Technologent; Transitional Data Services; StorageReview; TDWI; Varonis; Integrate.io; SyncMatters; Banken.nl; Data Center Knowledge; Datafold; DatacenterDynamics; DEV Community; Hevo Data; Brainhub; Copia Wealth Studios; DataFlowMapper; Glean; GTconsult; NetApp; Quinnox (2025); RudderStack; MSH; EnlightLab; FileFeed; Globema; Ispirer; Kanerika; Kovair; Ofima; Peliqan; Symmetric Health Solutions; The Virtual Forge
Why do data migrations fail or run over?
Industry studies of migration projects; none of these figures measures Zinstall's products.
68% of projects came in on schedule when companies profiled their data before estimating, against 55% when they did not (Bloor Research, 2011).

- More than two-thirds of the 2007 respondents whose projects overran blamed a failure to scope the project properly.
- Only 1 in 10 respondents used data profiling tools in 2007; by 2011 more than 70% did.
- Only 28% of projects had no data quality issues at all after migration, in the 2017 practitioner study.
- 55% of IT professionals blamed migration failures on applications that could not be started on the new server in time.
- 64% of organisations named data quality their top data integrity challenge in 2024, up from 50% a year earlier.
| Practice and survey year | Share of projects |
|---|---|
| 2007: projects using data profiling tools | 10% |
| 2011: projects using data profiling tools (lower bound) | over 70% |
| 2007: projects using a formal methodology | about 70% |
| 2011: projects using a formal methodology (lower bound) | over 90% |
| 2011: projects on schedule when it was not | 55% |
| 2007: projects with no separate migration budget | almost 20% |
| 2007: projects based on in-house approaches (via BCS) | 75% |
| 2011: companies profiling data before estimating | 50% |
Sources: Bloor Research (2011, 2007); eWeek; Experian / Data Migration Pro; ChannelInsider; Precisely / Drexel LeBow; BCS; Experian Data Quality (2017, 2016, 2015); Experian (2020, 2018)
More statistics (80)
68% of data migration projects came in on schedule among companies that profiled their data before estimating, against 55% among those that did not, in Bloor Research's spring 2011 survey (Bloor Research, 2011).
The surveys agree on the cause more than they agree on the rate. Data that turns out to be dirtier, more duplicated or more oddly structured than anyone estimated is the most cited reason for overruns in Bloor's work, and the practitioners Experian surveyed a decade later said the same: scoping, standardisation and the interpretation of business rules trip projects up, and collaboration between the business and the technical team is what rescues them. The one practice with a measured effect is profiling the data before estimating the project, which Bloor found improved the odds of finishing on schedule. Below that sit the broader data-quality figures, including two widely quoted cost estimates whose origins the records trace.
- Poor data quality, or lack of visibility into data quality issues, was the most commonly cited reason for data migration project overruns in Bloor Research's spring 2011 survey (Bloor Research, 2011).
- Business engagement was by far the most commonly cited of the three critical success factors respondents named in Bloor Research's spring 2011 data migration survey (Bloor Research, 2011).
- 55% of data migration projects came in on schedule among companies that did not profile their data before estimating, in Bloor Research's spring 2011 survey (Bloor Research, 2011).
- $170,000 per project was the average cost saving from implementing all six quantified success factors together, according to Bloor Research's 2011 data migration survey (Bloor Research, 2011).
- Seven critical success factors for data migration projects, six of them quantifiable, were identified in the final results of Bloor Research's 2011 data migration survey (Bloor Research, 2011).
- More than two-thirds of respondents whose data migration projects overran blamed a failure to properly scope the project, in Bloor Research's 2007 survey as reported by eWeek (eWeek citing Bloor Research, 2007).
- 1 in 10 respondents used data profiling tools to understand their data in Bloor Research's 2007 data migration survey, as reported by eWeek (eWeek citing Bloor Research, 2007).
- A major reason data migration projects overrun or fail is that the techniques and disciplines of data migration are not treated seriously enough or well enough understood, according to Bloor Research's 2007 white paper (Bloor Research, 2007).
- 85% of companies faced data migration challenges in Experian Data Quality's 2015 data migration study (Experian Data Quality, 2015).
- 91% of companies engaged in data migration projects in Experian Data Quality's 2015 data migration study (Experian Data Quality, 2015).
- A lack of collaboration or knowledge sharing across departments, technology providers or database consultants was the most common data migration challenge in Experian Data Quality's 2015 study (Experian Data Quality, 2015).
- 37% of respondents named a lack of data standardisation or consistency as a data migration challenge in Experian Data Quality's 2015 study (Experian Data Quality, 2015).
- 33% of organisations saw poor system design as a significant data migration challenge in Experian Data Quality's 2015 study (Experian Data Quality, 2015).
- A quarter of companies said poor interpretation of business data rules was a data migration challenge in Experian Data Quality's 2015 study (Experian Data Quality, 2015).
- 28% of data migration projects experienced no data quality issues at all after migration in the Experian and Data Migration Pro study of 270 practitioners in 2017 (Experian / Data Migration Pro, 2017).
- 43% of data migration projects had effective governance and management in the Experian and Data Migration Pro study of 270 practitioners in 2017 (Experian / Data Migration Pro, 2017).
- 50% of data migration projects had effective business engagement in the Experian and Data Migration Pro study of 270 practitioners in 2017 (Experian / Data Migration Pro, 2017).
- 52% of respondents felt the scoping of their data migration project was effective in the Experian and Data Migration Pro study of 270 practitioners in 2017 (Experian / Data Migration Pro, 2017).
- 46% of respondents felt their data migration project was planned and forecast effectively in the Experian and Data Migration Pro study of 270 practitioners in 2017 (Experian / Data Migration Pro, 2017).
- 62% of data migration projects relied on phased migration execution in the Experian and Data Migration Pro study of 270 practitioners in 2017 (Experian / Data Migration Pro, 2017).
- More than 60% of respondents cited bad data and duplicate data as the primary reasons for data quality problems in the Information Architecture Team's 2002 data migration survey (IAT via KDnuggets, 2002).
- Nearly 3 months longer than planned was the typical overrun of the data mapping phase, and over 4 months for testing, in the Information Architecture Team's 2002 data migration survey (IAT via KDnuggets, 2002).
- Over 4 months longer than planned was the typical overrun of the testing phase in the Information Architecture Team's 2002 data migration survey (IAT via KDnuggets, 2002).
- 55% of IT professionals cited the inability to start applications on the new server in the required timeframe as the biggest reason for migration failure, followed by a lack of testing (38%), in Vision Solutions' 2016 State of Resilience report (ChannelInsider citing Vision Solutions, 2016).
- 38% of IT professionals cited a lack of testing as a reason for migration failure in Vision Solutions' 2016 State of Resilience report (ChannelInsider citing Vision Solutions, 2016).
- 70% of IT professionals had not calculated the hourly cost of migration downtime according to Vision Solutions' 2016 State of Resilience report, as reported by ChannelInsider (ChannelInsider citing Vision Solutions, 2016).
- Under-estimated testing and data migration phases were among the main reasons SAP S/4HANA migrations missed their targets in Horvath's 2025 study of 200 SAP user companies (CIO citing Horvath, 2025).
- 46% of respondents would in hindsight estimate a longer project duration for their SAP S/4HANA migration, more than 40% would increase the budget and 30% would reduce the scope, in Horvath's 2025 study (CIO citing Horvath, 2025).
- Moving data from source to target database, testing the target database including integrations, and converting database schemas were the three most time-intensive tasks in IT leaders' most challenging migrations in Caylent's 2025 survey (Caylent, 2025).
- 67% of data and analytics leaders said they did not completely trust the data their organisation used for decision-making, up from 55% a year earlier, in the 2024 Precisely and Drexel LeBow survey of 565 leaders (Precisely / Drexel LeBow, 2024).
- 64% of organisations named data quality as their top data integrity challenge, up from 50% in 2023, in the 2024 Precisely and Drexel LeBow survey of 565 data leaders (Precisely / Drexel LeBow, 2024).
- 50% of respondents said data quality was the number one issue affecting their organisation's data integration projects in the 2024 Precisely and Drexel LeBow survey of 565 data leaders (Precisely / Drexel LeBow, 2024).
- 95% of organisations saw impacts from poor data quality in Experian's 2019 Global Data Management Report (Experian, 2019).
- Human error was the biggest contributor to a lack of data accuracy, cited by 50% of organisations in Experian's 2019 Global Data Management Report (Experian, 2019).
- 78% of organisations said data debt (the accumulated cost of poor governance of data) was a challenge, and 28% called it a significant problem, in Experian's 2020 Global Data Management research (Experian, 2020).
- Business involvement at all stages, a tried and tested methodology, in-house migration knowledge and stakeholder care were the major contributory factors to data migration success apart from technology, according to Bloor Research in 2015 (Bloor Research, 2015).
- Bloor Research concluded in 2008 that traditional data integration tools on their own were not enough for data migration, and that methodologies, experienced professionals and special-purpose tools were needed (Bloor Research, 2008).
- A large number of organisations fail to use tools such as data profiling in migration projects to understand the extent of their data issues, Experian Data Quality wrote in its 2015 data migration paper (Experian Data Quality, 2015).
- Many data migration projects exceed budget and/or cause business disruption through flawed execution, which 85% of companies experience as data migration challenges, according to Experian Data Quality's 2015 paper (Experian Data Quality, 2015).
- The complexity of data migrations is increasing because of data volumes and legacy systems, the Experian and Data Migration Pro 2017 study found (Experian / Data Migration Pro, 2017).
- 43% of data migration projects had a project management team with a good understanding of data migration best practice in the Experian and Data Migration Pro study of 270 practitioners in 2017 (Experian / Data Migration Pro, 2017).
- A pre-migration impact assessment at the very start of the project was the single tactic Data Migration Pro's editor drew from the 2017 study, because most problems seen (poor planning, forecasting, scoping) stemmed from a lack of early impact analysis (Experian / Data Migration Pro, 2017).
- More than 1,400 data professionals across eight countries were polled for Experian Data Quality's 2017 global data management benchmark report (Experian Data Quality, 2017).
- More than 1,100 data practitioners and business leaders across six countries were surveyed by Insight Avenue for Experian in October 2019 for the 2020 Global Data Management research (Experian, 2020).
- 77% of respondents rated their organisation's data quality as average at best, up from 66% a year earlier, in the 2024 Precisely and Drexel LeBow survey of 565 data leaders (Precisely / Drexel LeBow, 2024).
- Inadequate tools for automating data quality processes (49%) and inconsistent data definitions and formats (45%) were the top factors keeping organisations from high-quality data in the 2024 Precisely and Drexel LeBow survey (Precisely / Drexel LeBow, 2024).
- Use data profiling early and often is action No. 4 of Gartner's 12 actions to improve data quality, because profiling identifies which data quality issues must be fixed at source before a project (Gartner, 2021).
- 25% of major international companies were working with poor-quality data, Gartner analyst Ted Friedman's research found, with bad data called a leading cause of BI and CRM project failure (InformationWeek, 2004).
- Over 90% of respondents said incomplete mapping, speed of data movement over the network and load monitoring were the most critical problems causing project delays or failures in the Information Architecture Team's 2002 survey (IAT via KDnuggets, 2002).
- 56% of organisations migrated Hadoop data to the cloud by physically shipping it or by using tools not designed for on-premises-to-cloud migration such as DistCp (48%), in WANdisco's 2021 benchmark survey (IT Brief citing WANdisco, 2021).
| Practice and survey year | Share of projects | Scope |
|---|---|---|
| 2007: projects using data profiling tools | 10% | Data migration projects at Global 2000 organisations with a total project budget of $1m or more, surveyed by Bloor Research in 2007 · Worldwide · 2007 |
| 2011: projects using data profiling tools (lower bound) | over 70% | Data migration projects at organisations surveyed by Bloor Research in spring 2011 (not limited to the Global 2000); provisional figures · Worldwide · 2011 |
| 2007: projects using a formal methodology | about 70% | Data migration projects at Global 2000 organisations with a total project budget of $1m or more, surveyed by Bloor Research in 2007 · Worldwide · 2007 |
| 2011: projects using a formal methodology (lower bound) | over 90% | Data migration projects at organisations surveyed by Bloor Research in spring 2011 (not limited to the Global 2000); provisional figures · Worldwide · 2011 |
| 2011: projects on schedule when data was profiled before estimating | 68% vs 55% | Data migration projects at organisations surveyed by Bloor Research in spring 2011 (not limited to the Global 2000); provisional figures · Worldwide · 2011 |
| 2011: projects on schedule when it was not | 55% | Data migration projects at organisations surveyed by Bloor Research in spring 2011 (not limited to the Global 2000); provisional figures · Worldwide · 2011 |
| 2007: projects with no separate migration budget | almost 20% | Data migration projects at Global 2000 organisations with a total project budget of $1m or more, surveyed by Bloor Research in 2007 · Worldwide · 2007 |
| 2007: projects based on in-house approaches (via BCS) | 75% | Data migration projects at Global 2000 organisations with a total project budget of $1m or more, surveyed by Bloor Research in 2007 · Worldwide · 2007 |
| 2011: companies profiling data before estimating | 50% | Data migration projects at organisations surveyed by Bloor Research in spring 2011 (not limited to the Global 2000); provisional figures · Worldwide · 2011 |
| Edition and population | Share of data | Scope |
|---|---|---|
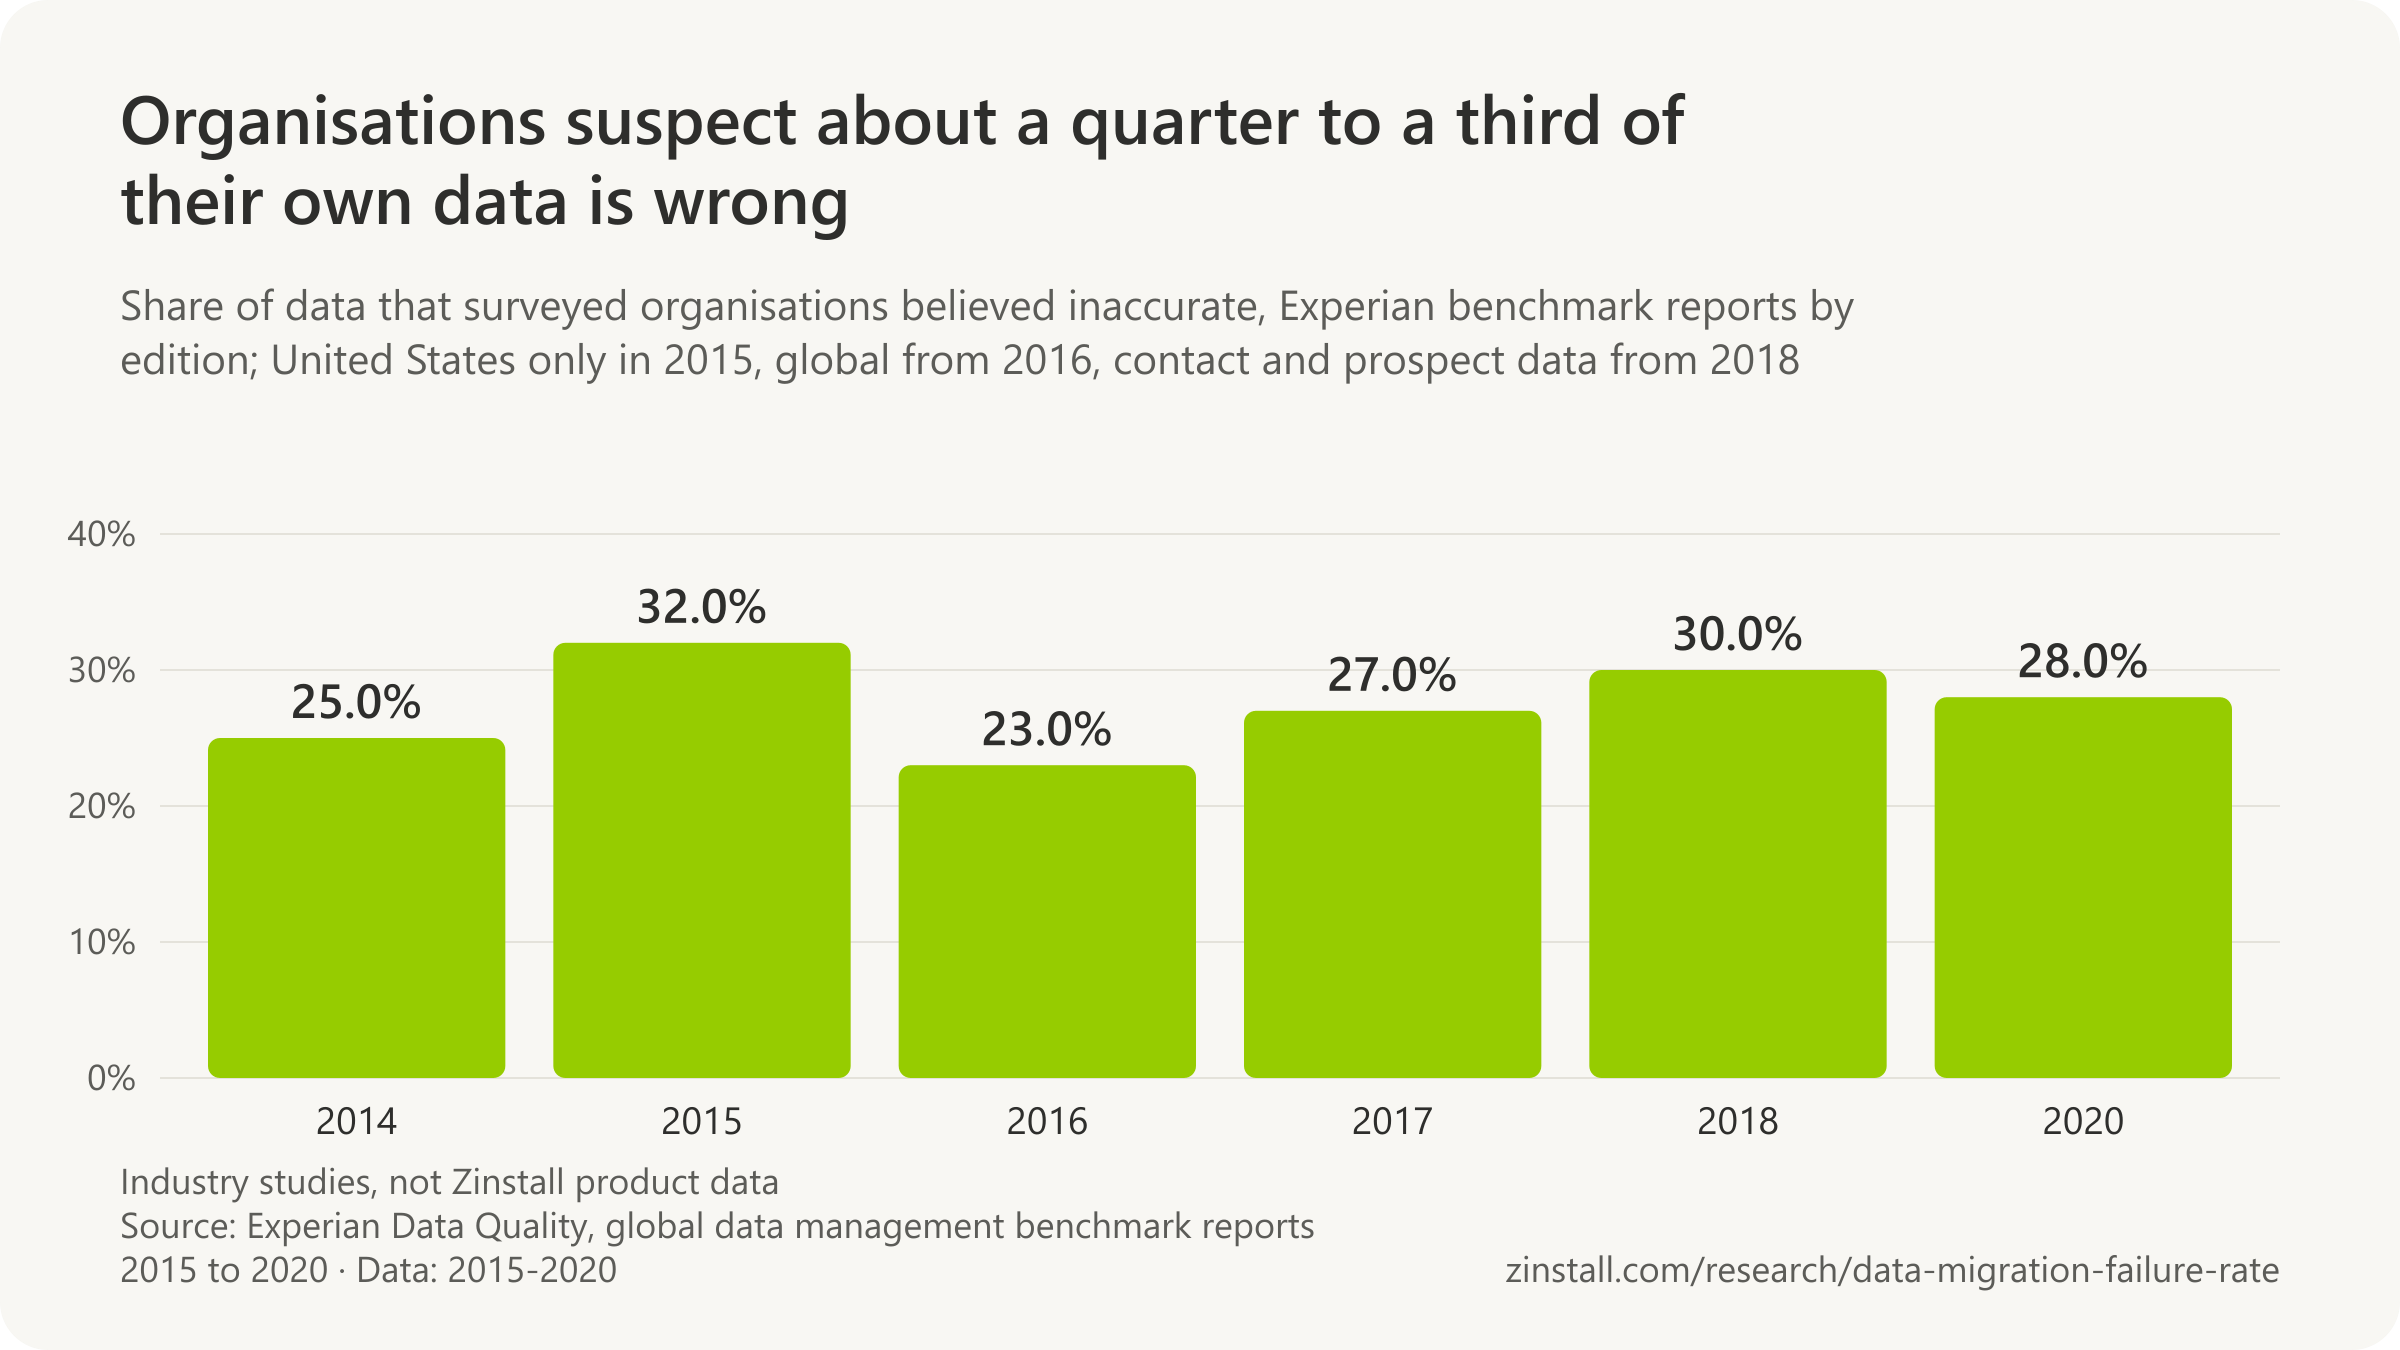
| 2015 (United States) | 32% | US organisations surveyed for Experian Data Quality's 2015 data quality benchmark (sample size not stated) · United States · 2015 |
| 2016 (global) | 23% | Organisations surveyed for Experian Data Quality's 2016 global data management benchmark (sample size not stated in the release) · Worldwide · 2016 |
| 2017 (global, 1,400 professionals in eight countries) | 27% | More than 1,400 data professionals across eight countries polled for Experian Data Quality's 2017 global data management benchmark · Worldwide · 2017 |
| 2018 (contact and prospect data) | 30% | 1,000 employees with visibility of data management at organisations of 250+ employees in the UK, US, Australia and Brazil, surveyed by Insight Avenue for Experian (2018 global data management report) · Worldwide · 2018 |
| 2019 (contact and prospect data, 'almost a third') | almost a third | Organisations surveyed for Experian's 2019 Global Data Management Report (sample size not stated on the page) · Worldwide · 2019 |
| 2020 (customer and prospect data, 1,100 respondents in six countries) | 28% | More than 1,100 data practitioners and data-driven business leaders in the US, UK, Germany, France, Brazil and Australia, surveyed by Insight Avenue for Experian in October 2019 · Worldwide · 2020 |
| Edition and measure | Share | Scope |
|---|---|---|
| 2015 (United States): revenue felt to be wasted because of inaccurate data, average | 27% | US organisations surveyed for Experian Data Quality's 2015 benchmark · United States · 2015 |
| 2015 (United States): respondents who believed revenue was affected by inaccurate data | 91% | US organisations surveyed for Experian Data Quality's 2015 benchmark · United States · 2015 |
| 2016: inaccurate data undermining the customer experience | 75% | Organisations surveyed for Experian Data Quality's 2016 global data management benchmark · Worldwide · 2016 |
| 2017: organisations relying on educated guesses or gut feel | 52% | More than 1,400 data professionals across eight countries polled for Experian Data Quality's 2017 global data management benchmark · Worldwide · 2017 |
| 2017: organisations with less than optimum data practices | 82% | More than 1,400 data professionals across eight countries polled for Experian Data Quality's 2017 global data management benchmark · Worldwide · 2017 |
| 2018: inaccurate data undermining the customer experience | 69% | 1,000 employees with visibility of data management at organisations of 250+ employees in the UK, US, Australia and Brazil, surveyed by Insight Avenue for Experian (2018 global data management report) · Worldwide · 2018 |
| 2019: inaccurate data undermining the customer experience | 69% | Organisations surveyed for Experian's 2019 Global Data Management Report (sample size not stated on the page) · Worldwide · 2019 |
| 2019: organisations seeing impacts from poor data quality | 95% | Organisations surveyed for Experian's 2019 Global Data Management Report (sample size not stated on the page) · Worldwide · 2019 |
| 2020: organisations for which data debt is a challenge | 78% | More than 1,100 data practitioners and data-driven business leaders in the US, UK, Germany, France, Brazil and Australia, surveyed by Insight Avenue for Experian in October 2019 · Worldwide · 2020 |
| 2020: data debt hurting new initiatives | 66% | More than 1,100 data practitioners and data-driven business leaders in the US, UK, Germany, France, Brazil and Australia, surveyed by Insight Avenue for Experian in October 2019 · Worldwide · 2020 |
| 2020: organisations with a strategy for their data debt | 24% | More than 1,100 data practitioners and data-driven business leaders in the US, UK, Germany, France, Brazil and Australia, surveyed by Insight Avenue for Experian in October 2019 · Worldwide · 2020 |
What bad data is said to cost
- $12.9 million a year is the estimated average cost of poor data quality to an organisation, Gartner analyst Melody Chien said at the Gartner Data and Analytics Summit in Sydney in 2022 (Gartner, 2022).
- $3.1 trillion a year is what poor data quality costs the US economy according to IBM's 'Four V's of Big Data' infographic, which lists nine sources without saying which one supplied the figure (IBM, 2013).
- $3.1 trillion a year was analyst Hollis Tibbetts's own estimate of the cost of dirty, inconsistent and redundant data to the US economy in a 2011 Artemis Ventures press release, the earliest dated appearance of the figure found (Artemis Ventures, 2011).
- $3.1 trillion was IBM's estimate of the yearly cost of poor quality data in the US alone in 2016, as restated by Thomas Redman in Harvard Business Review (HBR citing IBM, 2016).
- More than $600 billion a year was The Data Warehousing Institute's 2002 estimate of the cost of data quality problems to US businesses, as restated by KDnuggets (KDnuggets citing TDWI, 2002).
- 1 in 3 business leaders did not trust the information they used to make decisions, according to IBM's 'Four V's of Big Data' infographic (IBM, 2013).
Sources: Bloor Research (2007-2015); eWeek; Experian Data Quality (2015, 2016, 2017); Experian / Data Migration Pro (2017, 2018); Information Architecture Team; ChannelInsider; CIO; Caylent; Precisely / Drexel LeBow; Experian (2018, 2019, 2020); Gartner (2021, 2022); InformationWeek; IT Brief Australia; BCS; IBM; Artemis Ventures LLC; Harvard Business Review; KDnuggets
What is the cloud migration failure rate?
Industry studies of migration projects; none of these figures measures Zinstall's products.
Only 37% of large enterprises said they were getting the full value they expected from the cloud in 2020 (Accenture, 2020).

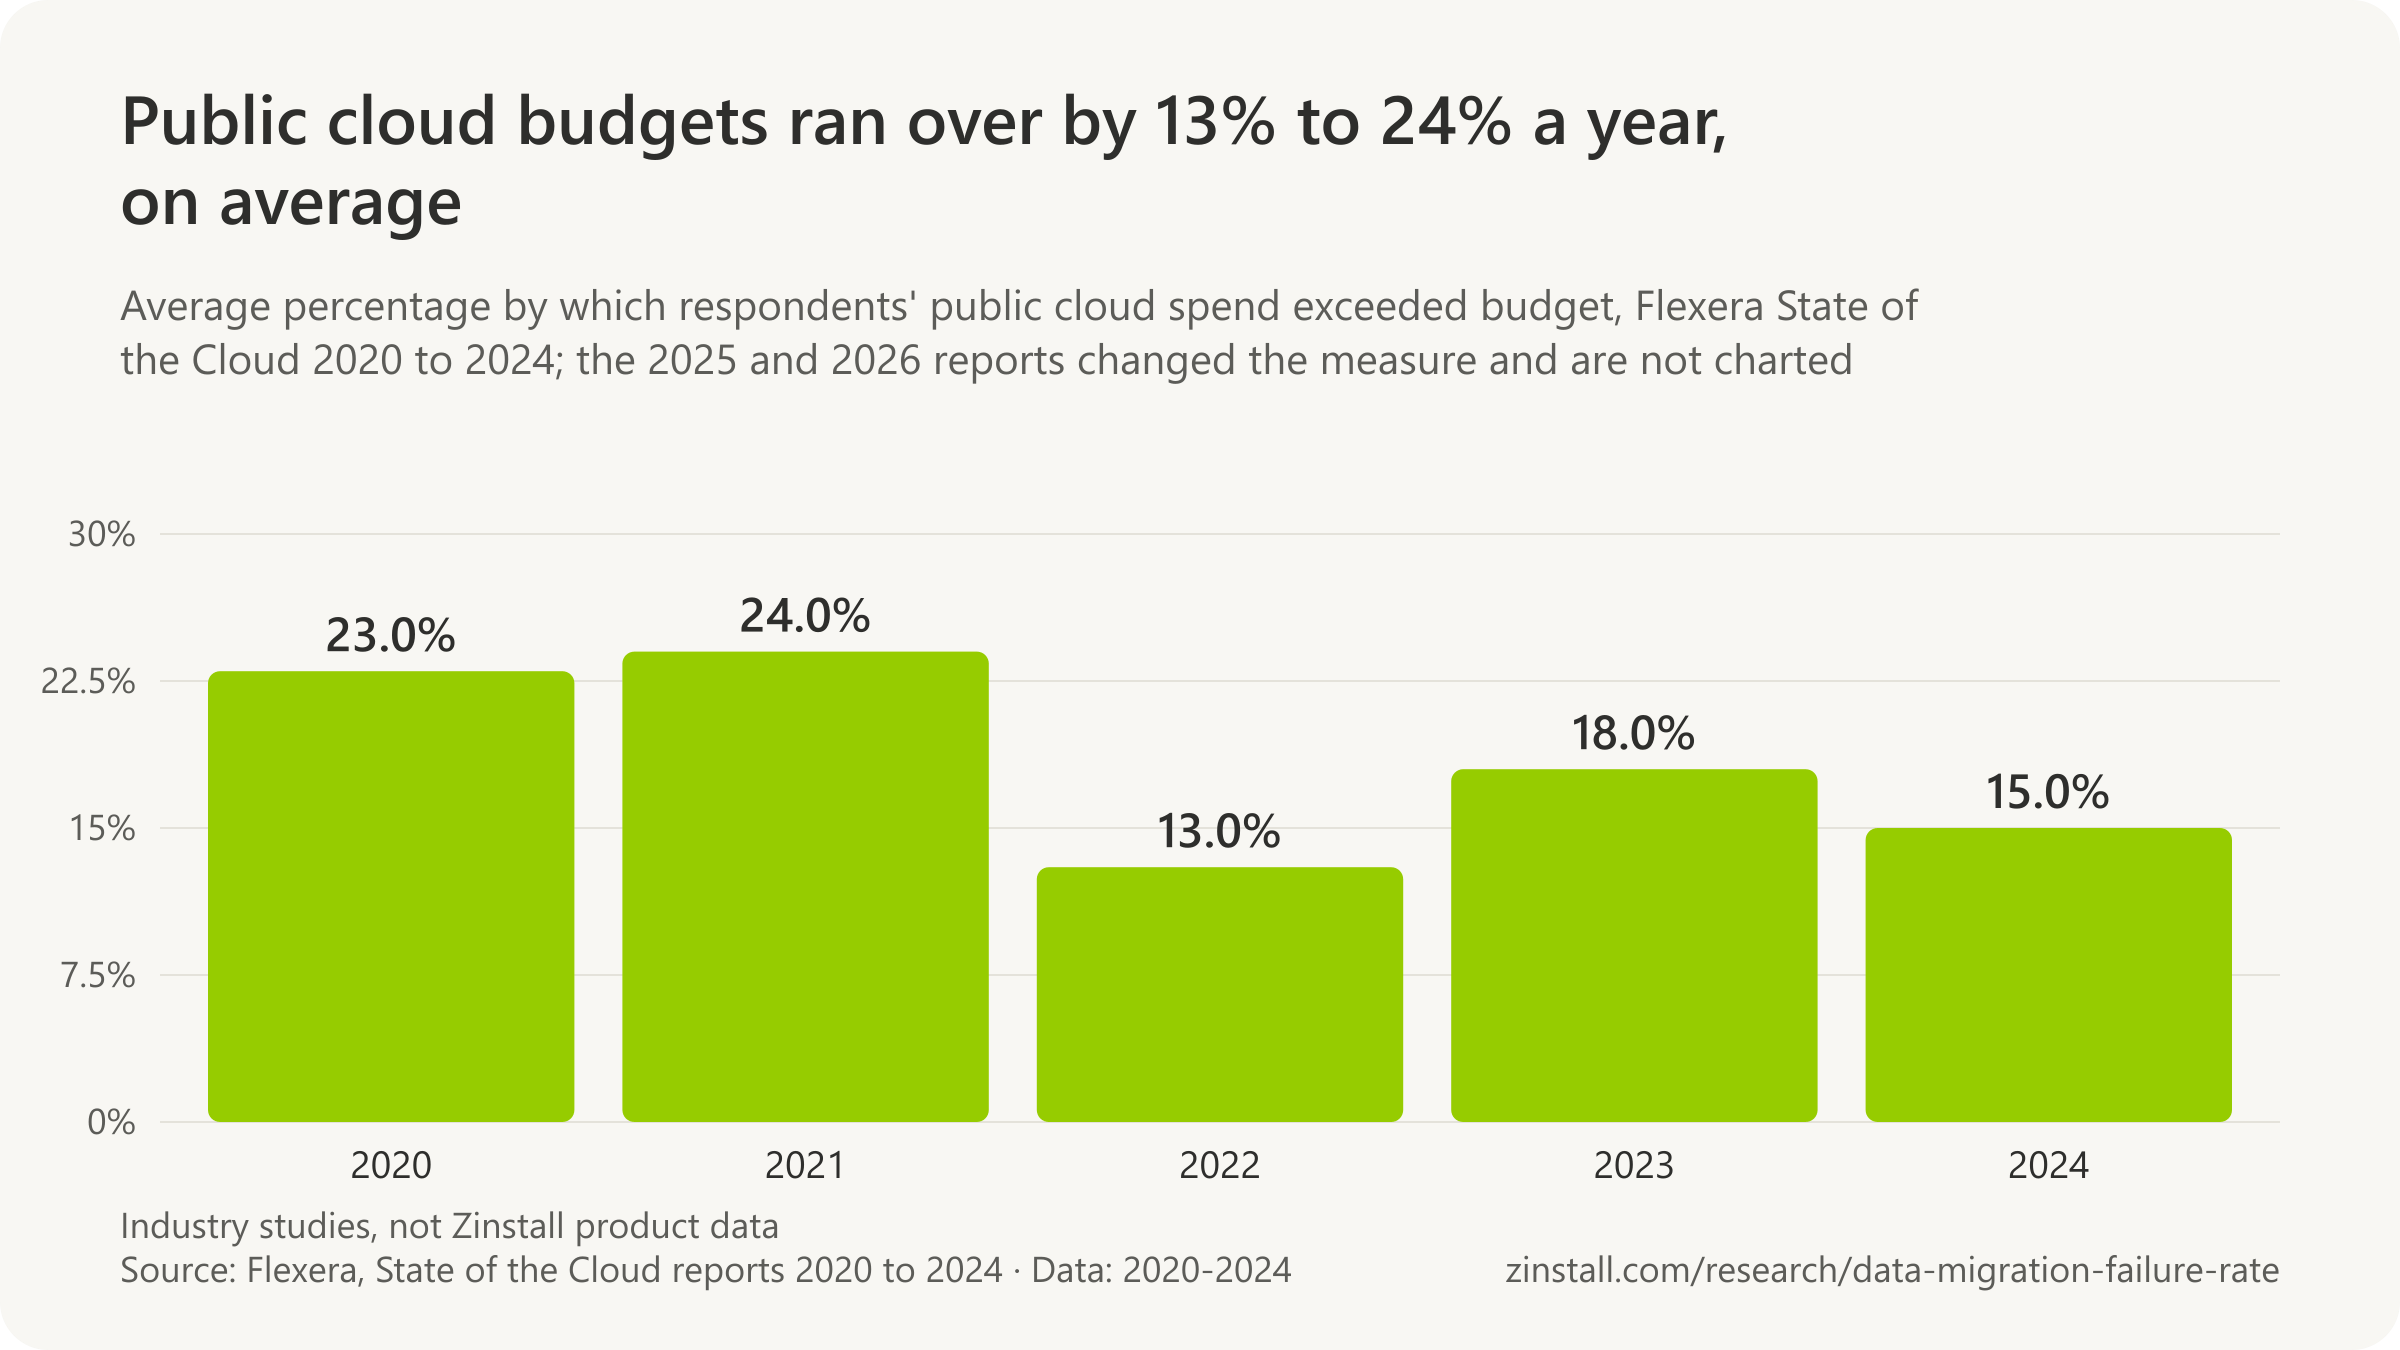
- Cloud buyers estimated 29% of their public cloud spend was wasted in 2026, the first rise in five years (Flexera, 2026).
- 85% of respondents called managing cloud spend a top challenge in 2026, ahead of security.
- 21% of cloud workloads had been moved back out of the cloud by 2025.
- 1 in 4 organisations were hindered by unexpected complications in their cloud migrations.
- 30% of senior leaders in 13 countries said their organisation had failed to realise notable cloud benefits, in 2019.
| Survey, year and what was asked | Share |
|---|---|
| 2019, IHS Markit for Fortinet, 350 companies: had ever moved at least one application back out of public cloud | 74% |
| 2019, Vanson Bourne for Nutanix, 2,650 IT decision-makers: currently moving some applications back on premises | 73% |
| 2020, Barclays CIO survey (via trade press): planning to move some workloads back | 43% |
| 2024, Barclays CIO survey (via trade press): planning to move some workloads back | 83% |
| 2024, IDC: expecting some repatriation of compute or storage in the next twelve months | about 80% |
| 2024, IDC: planning full repatriation | 8-9% |
| 2022, IDG for Supermicro: expecting to move workloads back | 71% |
Sources: Accenture; Flexera (2020-2026); Unisys; Fortinet; Nutanix; Barclays; IDC (2024a, 2024b); IDG
More statistics (101)
37% of the 750 senior business and IT professionals at large enterprises surveyed by Accenture in 2020 said their company was achieving the full value expected from its cloud investments, 2 points more than in Accenture's 2018 survey (Accenture, 2020).
Cloud migration has the richest run of annual data of any migration type, because Flexera has asked the same panel about its cloud budgets every year for a decade, and it has the loudest marketing around it. The measured picture is steadier than the headlines: respondents have put the waste in their own cloud bills at roughly three dollars in ten every year since the RightScale era, they ran over budget by a sixth to a quarter in the years Flexera published an average, and fewer than four in ten told Accenture they had got the full value they expected. Repatriation is where the numbers are most abused, because the surveys ask different questions, from 'have you ever moved anything back' to 'do you plan to leave entirely', and the trade press drops the qualifier. The market-size figures are limited to two firms, because the roundups quote five incompatible definitions as if they were one number.
- 29% of IaaS and PaaS spend was wasted by the estimate of the 753 respondents to Flexera's 2026 State of the Cloud survey, the first rise in five years, which Flexera attributes to cloud-based AI workloads (Flexera, 2026).
- 15% over budget on average was the public cloud spend reported by the 753 respondents to Flexera's 2024 State of the Cloud survey, fielded in winter 2023 (Flexera, 2024).
- 17% of respondents reported exceeding their public cloud budgets in the past year in Flexera's 2026 State of the Cloud survey of 753 cloud decision-makers, fielded in winter 2025 (Flexera, 2026).
- 9% of the 750 companies in Flexera's 2023 State of the Cloud survey said their public cloud spend exceeded the planned IT budget by significantly more than expected (Flexera, 2023).
- 85% of the 753 respondents to Flexera's 2026 State of the Cloud survey said managing cloud spend was a top challenge, ahead of security (82%) and software licences (78%) (Flexera, 2026).
- 54% of the 753 respondents to Flexera's 2024 State of the Cloud survey reported understanding application dependencies as a cloud migration challenge, ahead of assessing on-premises versus cloud costs (46%) and technical feasibility (45%) (Flexera, 2024).
- 44% of the 750 respondents to Flexera's 2023 State of the Cloud survey expected progress on cloud migration in the next twelve months, 13 points fewer than the year before (Flexera, 2023).
- 21% of cloud-based workloads and 21% of cloud-based data had been repatriated to non-cloud environments according to the 759 respondents to Flexera's 2025 State of the Cloud survey (Flexera, 2025).
- 2 percentage points was the year-over-year rise in the share of cloud-based workloads and of cloud-based data that organizations had repatriated in Flexera's 2026 State of the Cloud survey of 753 (Flexera, 2026).
- 35% of the 200 senior IT executives at companies with revenue above $1 billion surveyed by Accenture in 2018 reported fully achieving their expected cloud outcomes across cost, speed, business enablement and service levels (Accenture, 2018).
- 29% of the 750 leaders surveyed by Accenture in 2020 were completely confident that their organization's cloud migration initiatives would deliver the expected value at the expected time (Accenture, 2020).
- 1 in 4 organizations were hindered by unexpected complications with cloud migrations in Accenture's 2020 survey of 750 senior business and IT professionals (Accenture, 2020).
- 54% of CEOs surveyed by Accenture in 2020 placed lack of skills among their top three barriers to cloud value, while security and compliance risk (46%) led among all 750 respondents (Accenture, 2020).
- 30% of the 1,045 senior business and IT leaders in 13 countries surveyed for the first Unisys Cloud Success Barometer in August and September 2019 said they had failed to realise notable benefits from cloud computing (Unisys, 2019).
- 37% of American businesses in the 2019 Unisys Cloud Success Barometer survey said they had failed to realize notable benefits from cloud computing, against 30% worldwide (Unisys, 2019).
- 30% of respondents to the 2019 Unisys Cloud Success Barometer said their expectations for managing or reducing costs through cloud were only somewhat met or below expectation, the joint weakest area alongside increased revenue (30%) (Unisys, 2019).
- 59% of cloud buyers in IDC's Cloud Pulse 4Q 2023 survey anticipated spending more on cloud than expected again in 2024 (IDC, 2024).
- 8% to 9% of companies plan full workload repatriation from the public cloud according to IDC's Server and Storage Workloads Survey, while most repatriate specific elements such as production data and backup (IDC, 2024).
- 80% of respondents expected some level of repatriation of compute and storage resources in the next 12 months in IDC's June 2024 report 'Assessing the Scale of Workload Repatriation' (IDC, 2024).
- 74% of the 350 companies surveyed by IHS Markit for Fortinet in 2019 had moved an application into the public cloud and then moved it back to on-premises or private cloud infrastructure (IHS Markit for Fortinet, 2019).
- 52% of the 350 companies surveyed by IHS Markit for Fortinet in 2019 cited performance, and 52% security, as factors driving them to move applications back out of the public cloud (IHS Markit for Fortinet, 2019).
- 73% of the 2,650 IT decision-makers in 24 countries surveyed by Vanson Bourne for Nutanix's 2019 Enterprise Cloud Index reported moving some applications off the public cloud and back on premises (Nutanix, 2019).
- 83% of enterprise CIOs planned to repatriate at least some workloads from the public cloud in 2024 according to the Barclays CIO Survey as reported by EE Times Europe and Channelnomics, up from 43% in late 2020 (Barclays, 2024).
- 60% of infrastructure and operations leaders would encounter public cloud cost overruns that hurt their on-premises budgets through 2024, Gartner predicted in 2021 (Gartner, 2021).
- 70% or more of companies had migrated at least some workloads into the public cloud by 2021, according to Gartner research cited in its cloud migration cost article (Gartner, 2021).
- 91% of the nearly 1,200 technology practitioners and decision makers surveyed by Forrester Consulting for HashiCorp's 2024 State of Cloud Strategy Survey reported waste in their cloud spend, down from 96% in 2023 (HashiCorp, 2024).
- 82% of the 350 IT and cloud decision makers at US and UK organizations with 250 or more employees surveyed by Arlington Research for Virtana in 2021 said their organization had incurred unnecessary public cloud costs (Virtana, 2021).
- $100 billion of market value was being lost across 50 of the top public software companies because cloud costs weighed on their margins relative to running their own infrastructure, Andreessen Horowitz estimated in 2021 (Andreessen Horowitz, 2021).
- $75 million in cumulative savings over two years was what Dropbox reported in its 2018 S-1 from an infrastructure optimization that mostly repatriated workloads from the public cloud, as cited by Andreessen Horowitz (Andreessen Horowitz, 2021).
- $1.3 million was 37signals' 2024 cloud bill after leaving AWS compute, down from a $3.2 million per year run rate, a saving of almost $2 million a year (37signals, 2024).
- $10 million or more over five years was 37signals' projected saving from leaving AWS for its own hardware, as its co-founder reported in October 2024 after the first full year off the cloud (37signals, 2024).
- 47% was the increase in cloud spend expected for the coming year by the 750 respondents to Flexera's 2020 State of the Cloud survey (Flexera, 2020).
- 28% was the increase in cloud spend expected for the coming year by the 759 respondents to Flexera's 2025 State of the Cloud survey (Flexera, 2025).
- 1,060 technology professionals answered RightScale's 2016 State of the Cloud survey in January 2016, in which lack of resources or expertise (32%) passed security (29%) as the most cited cloud challenge (RightScale, 2016).
- 93% of the 1,045 senior business and IT leaders surveyed for the 2019 Unisys Cloud Success Barometer said their organisations were migrating applications and systems to the cloud (Unisys, 2019).
- 59% of the 1,045 senior leaders surveyed for the 2019 Unisys Cloud Success Barometer managed their cloud adoption internally rather than with third-party help (Unisys, 2019).
- 83% of organisations where cloud was core to business strategy said organisational effectiveness improved after moving to the cloud, against 30% where cloud was a minor part, in the 2019 Unisys Cloud Success Barometer survey of 1,045 leaders (Unisys, 2019).
- 40% of the 350 companies surveyed by IHS Markit for Fortinet in 2019 said some of the cloud deployments they moved back were planned temporary deployments (IHS Markit for Fortinet, 2019).
- 22% of the respondents moving applications back on premises in Nutanix's 2019 Enterprise Cloud Index (survey of 2,650 IT decision-makers) were moving five or more applications (Nutanix, 2019).
- 73% of enterprises were 'moving apps back on prem' in Intelligent CIO's 2019 headline restating Nutanix's Enterprise Cloud Index, whose text says 73% of respondents are moving some applications back (Intelligent CIO, 2019).
- 65% of the 200 senior IT executives surveyed by Accenture in 2018 had not fully achieved their expected cloud benefits, with security and compliance risk (65%) the most cited top-three barrier (Accenture, 2018).
- 45% of the 750 business and IT leaders surveyed by Accenture in 2020 said they were very satisfied with their cloud outcomes, a 1-point gain over 2018 (Accenture, 2020).
- 46% of high cloud adopters reported fully achieving their expected cloud benefits, against 36% of moderate and 28% of low adopters, in Accenture's 2020 survey of 750 leaders (Accenture, 2020).
- Close to half of cloud buyers spent more on cloud than they expected in 2023, according to IDC's Cloud Pulse 4Q 2023 survey (IDC, 2024).
- 85% was the past high in the share of enterprises expecting to move workloads back from the cloud, according to IDC research vice president Natalya Yezhkova in 2022 (IDC, 2022).
- 70% to 80% of companies repatriate at least some data from the public cloud each year, IDC told Data Center Dynamics in 2023, describing repatriation as a steady trend since public cloud became mainstream (IDC, 2023).
- 83% of enterprises were 'repatriating workloads' in Channelnomics' 2024 account of the Barclays CIO survey figure, which it then qualifies as companies not workloads and as plans rather than completed moves (Channelnomics, 2024).
- 21.5% was the growth Gartner forecast for the worldwide public cloud services market in 2025 (Gartner, 2024).
- 21.3% was the growth Gartner forecast for worldwide public cloud services in 2026 in its 3Q25 forecast update, with the market projected to reach $1.48 trillion by 2029 (Gartner, 2025).
- 2x was the growth IDC forecast for global public cloud services spending between 2026 and 2029, with SaaS more than half of spend and PaaS the fastest-growing segment at 37% (IDC, 2026).
- One-third to one-half of the cost of running equivalent workloads in the cloud is what repatriation costs, according to the experts Andreessen Horowitz consulted for its 2021 essay (Andreessen Horowitz, 2021).
- 60% or more of companies cite cost savings as the reason to move to the cloud in the first place, Andreessen Horowitz noted in 2021 without naming a survey (Andreessen Horowitz, 2021).
- 10% to 30% or more of workloads stayed in the cloud even at the companies most aggressive about taking workloads back, among those Andreessen Horowitz spoke to in 2021 (Andreessen Horowitz, 2021).
- $700,000 was what 37signals spent on the Dell hardware for its cloud exit, recouped from savings during 2023 while its long-term cloud commitments rolled off (37signals, 2024).
- 94% of respondents to the 2022 HashiCorp State of Cloud Strategy Survey, conducted by Forrester Consulting in August 2022, noted avoidable cloud spend, with idle resources (66%), overprovisioning (59%) and skills gaps (47%) the top causes (HashiCorp, 2022).
- 66% of the nearly 1,200 respondents to HashiCorp's 2024 State of Cloud Strategy Survey said they increased cloud spending in the past year, up from 56% in 2023 (HashiCorp, 2024).
- 14% more migration spend than planned and 38% of companies delayed by more than a quarter was how Auxis restated McKinsey's 2021 cloud migration survey in 2023 (Auxis, 2023).
- 38% of projects involving data migration to the cloud fail, according to an unsourced 'recent study' in Onix's 2023 white paper, the same 38% McKinsey attached to migrations delayed by more than a quarter (Onix, 2023).
| Report year and measure | Share | Scope |
|---|---|---|
| 2017: wasted cloud spend, self-estimate (RightScale) | 30% | Technology professionals at large and small enterprises, RightScale State of the Cloud survey · Worldwide · 2017 (survey January 2017) |
| 2018: wasted cloud spend, self-estimate (RightScale) | 35% | Technology professionals at large and small enterprises, RightScale State of the Cloud survey · Worldwide · 2018 (survey January 2018) |
| 2019: wasted cloud spend, self-estimate | 27% | Technical professionals across organisations of varying sizes, RightScale State of the Cloud survey from Flexera · Worldwide · 2019 (survey January 2019) |
| 2019: waste as measured by Flexera's own tooling | 35% | Flexera customer cloud spend analysed alongside the 786-respondent survey · Worldwide · 2019 |
| 2020: wasted cloud spend, self-estimate | 30% | Cloud decision-makers and users (technical professionals and executive leaders) worldwide, Flexera State of the Cloud survey · Worldwide · 2020 (survey Q1 2020) |
| 2021: wasted cloud spend, self-estimate | 30% | Cloud decision-makers and users (technical professionals and executive leaders) worldwide, Flexera State of the Cloud survey · Worldwide · 2021 (survey Q4 2020) |
| 2022: wasted cloud spend, self-estimate | 32% | Cloud decision-makers and users (technical professionals and executive leaders) worldwide, Flexera State of the Cloud survey · Worldwide · 2022 (survey Q4 2021) |
| 2023: wasted public cloud spend, self-estimate | 28% | Cloud decision-makers and users (technical professionals and executive leaders) worldwide, Flexera State of the Cloud survey · Worldwide · 2023 (survey winter 2022) |
| 2024: wasted public cloud spend (IaaS and PaaS), self-estimate | 27% | Cloud decision-makers and users (technical professionals and executive leaders) worldwide, Flexera State of the Cloud survey · Worldwide · 2024 (survey winter 2023) |
| 2025: wasted public cloud spend (IaaS and PaaS), self-estimate | 27% | Cloud decision-makers and users (technical professionals and executive leaders) worldwide, Flexera State of the Cloud survey · Worldwide · 2025 (survey winter 2024) |
| 2026: wasted public cloud spend (IaaS and PaaS), self-estimate | 29% | Cloud decision-makers and users (technical professionals and executive leaders) worldwide, Flexera State of the Cloud survey · Worldwide · 2026 (survey winter 2025) |
| 2020: average overrun of public cloud budgets | 23% | Cloud decision-makers and users (technical professionals and executive leaders) worldwide, Flexera State of the Cloud survey · Worldwide · 2020 (survey Q1 2020) |
| 2021: average overrun | 24% | Cloud decision-makers and users (technical professionals and executive leaders) worldwide, Flexera State of the Cloud survey · Worldwide · 2021 (survey Q4 2020) |
| 2022: average overrun | 13% | Cloud decision-makers and users (technical professionals and executive leaders) worldwide, Flexera State of the Cloud survey · Worldwide · 2022 (survey Q4 2021) |
| 2023: average overrun | 18% | Cloud decision-makers and users (technical professionals and executive leaders) worldwide, Flexera State of the Cloud survey · Worldwide · 2023 (survey winter 2022) |
| 2024: average overrun | 15% | Cloud decision-makers and users (technical professionals and executive leaders) worldwide, Flexera State of the Cloud survey · Worldwide · 2024 (survey winter 2023) |
| 2025: amount by which budgets were exceeded (wording changed) | 17% | Cloud decision-makers and users (technical professionals and executive leaders) worldwide, Flexera State of the Cloud survey · Worldwide · 2025 (survey winter 2024) |
| 2026: share of respondents who exceeded their budget (measure changed) | 17% | Cloud decision-makers and users (technical professionals and executive leaders) worldwide, Flexera State of the Cloud survey · Worldwide · 2026 (survey winter 2025) |

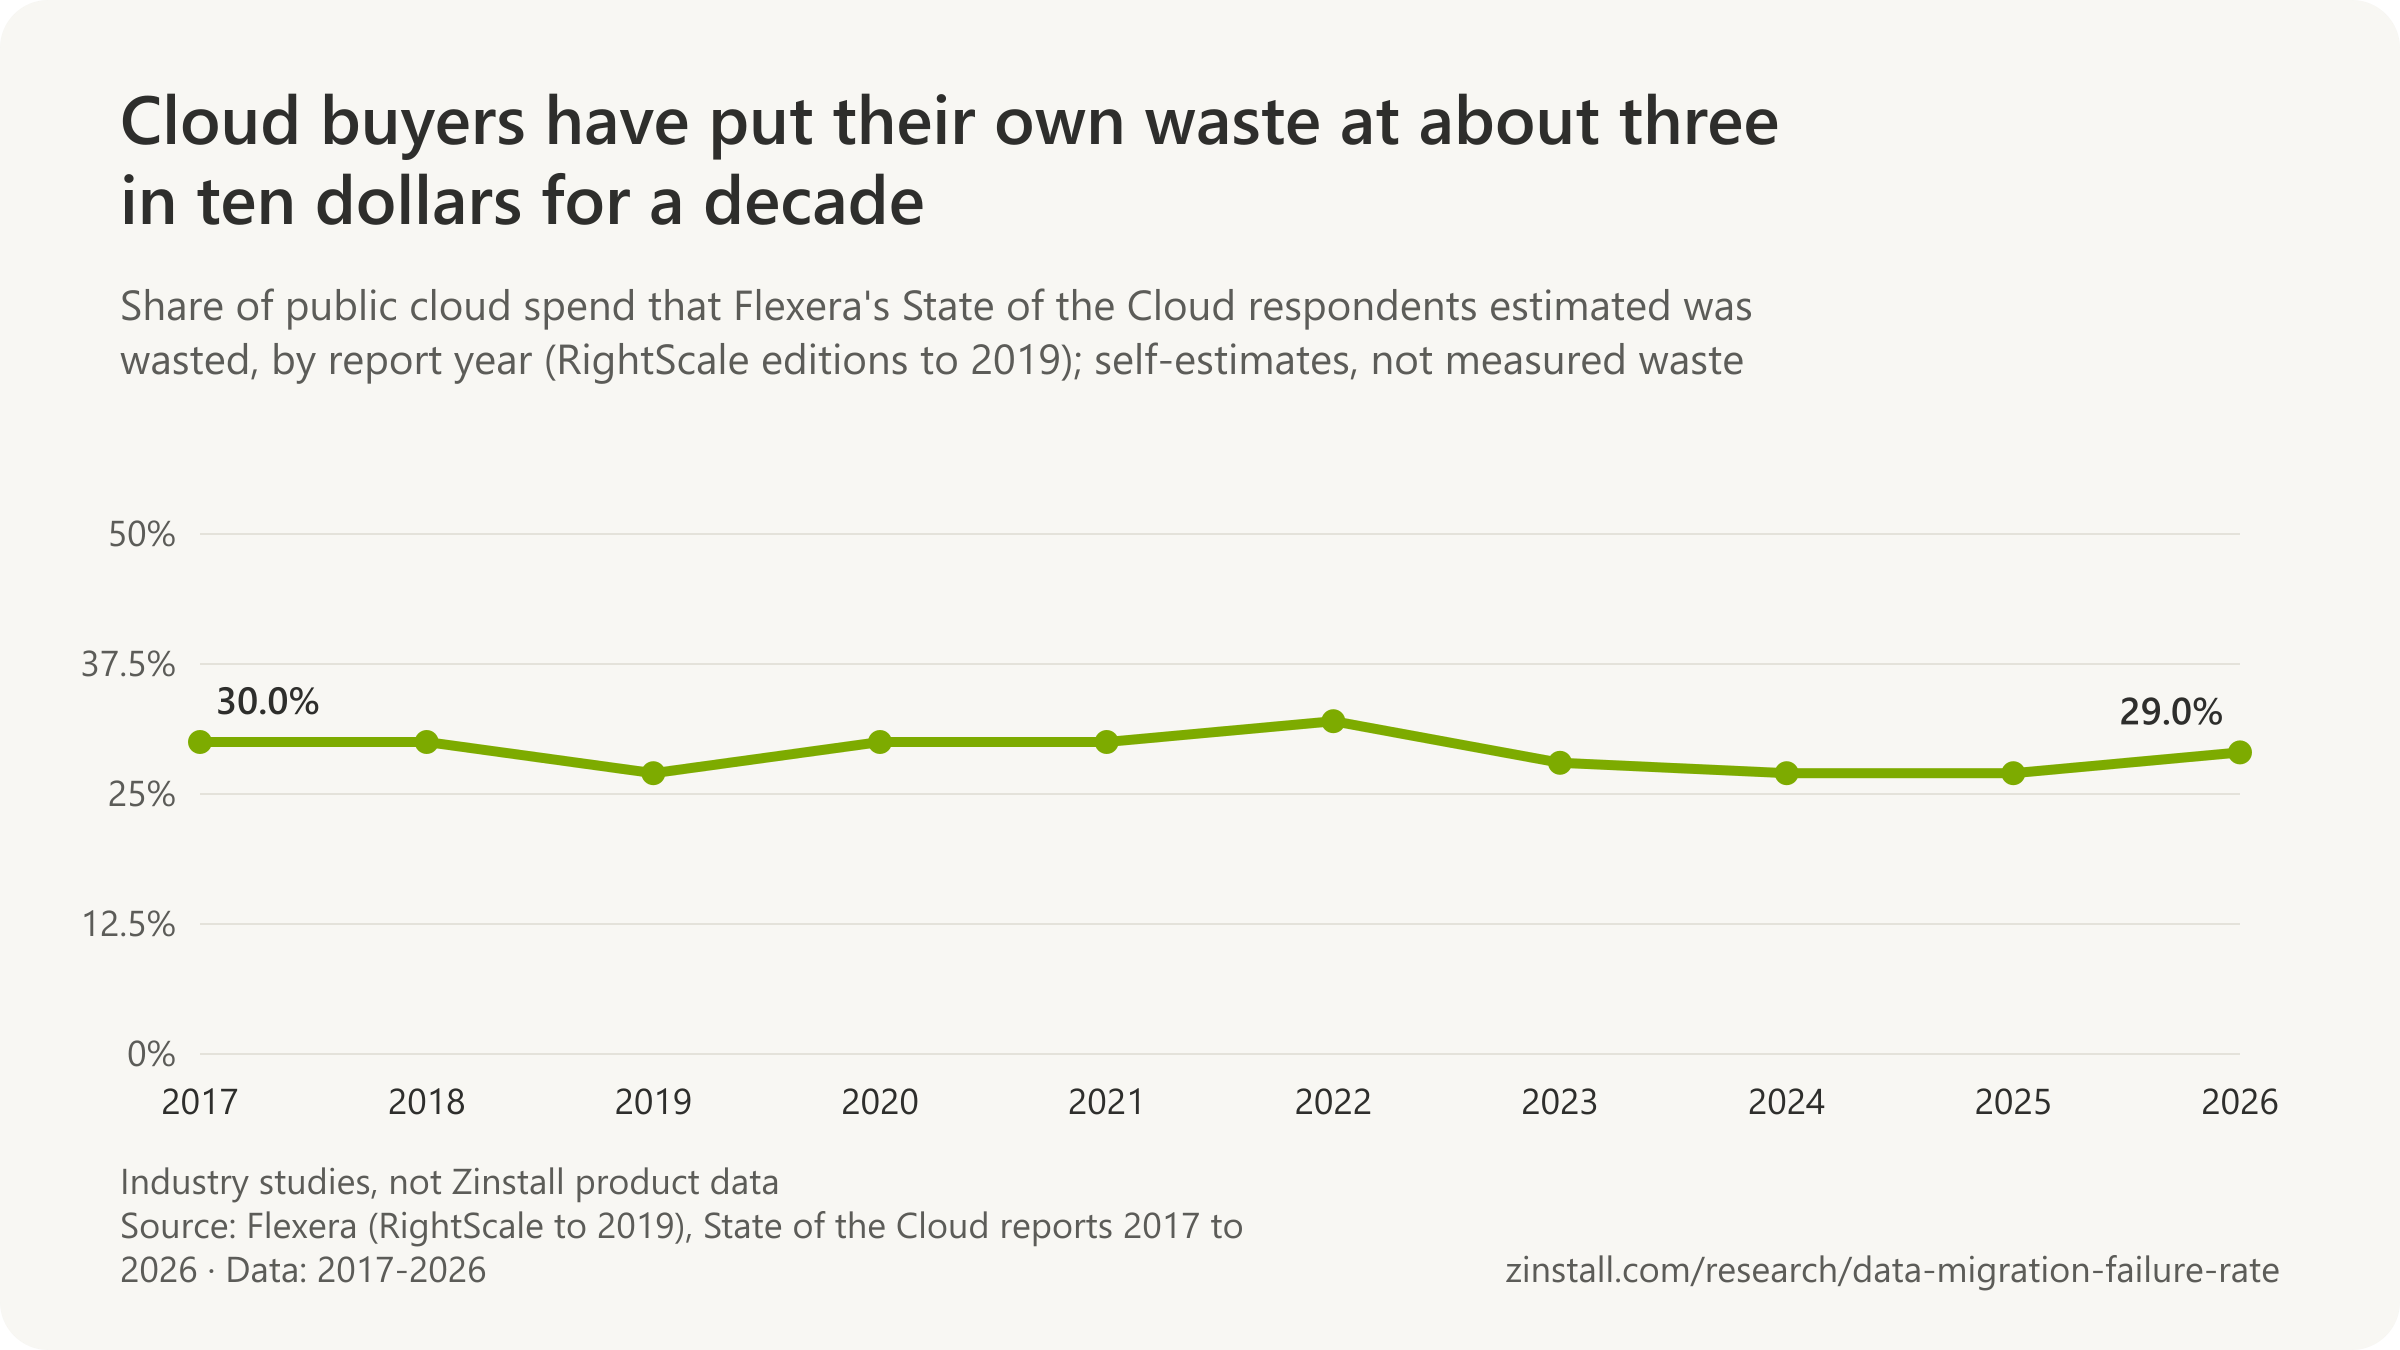
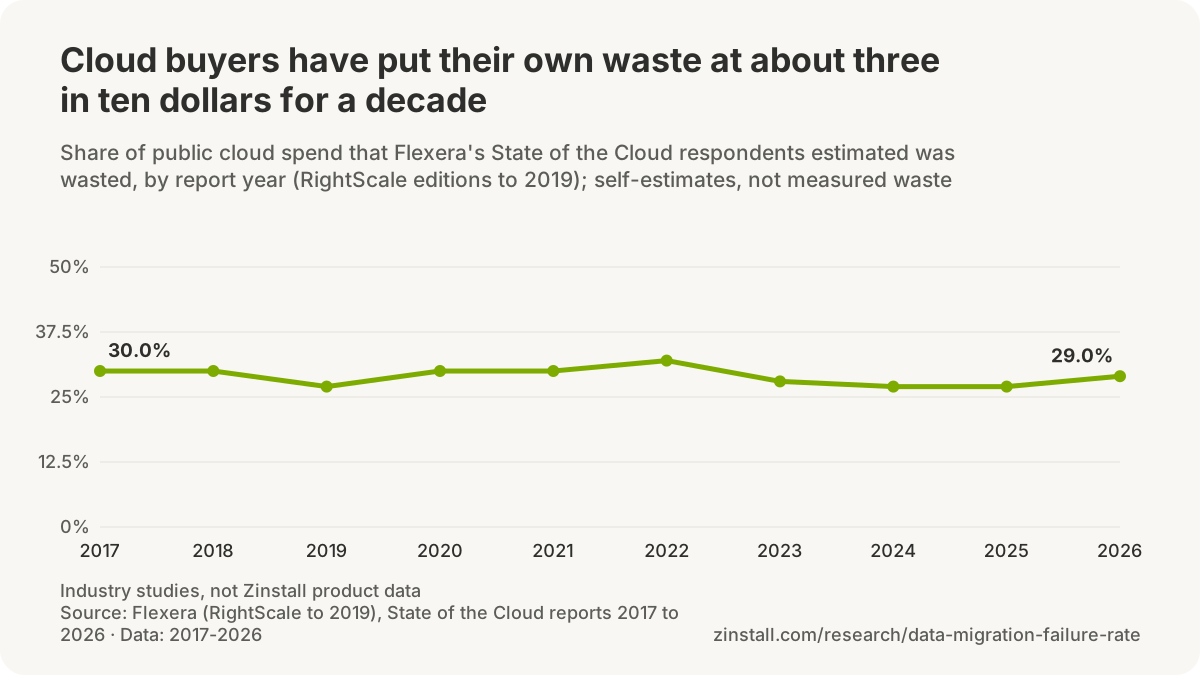
| Report year and challenge | Share of respondents | Scope |
|---|---|---|
| 2018 (RightScale, 997 respondents): managing cloud spend a challenge | 76% | Technology professionals at large and small enterprises, RightScale State of the Cloud survey · Worldwide · 2018 (survey January 2018) |
| 2020, enterprises: managing cloud spend a challenge (second to security) | 82% | Enterprise respondents (1,000+ employees) in Flexera's 2020 survey of 750 · Worldwide · 2020 (survey Q1 2020) |
| 2022: managing cloud spend a challenge | 81% | Cloud decision-makers and users (technical professionals and executive leaders) worldwide, Flexera State of the Cloud survey · Worldwide · 2022 (survey Q4 2021) |
| 2023: managing cloud spend, the top challenge for the first time | 82% | Cloud decision-makers and users (technical professionals and executive leaders) worldwide, Flexera State of the Cloud survey · Worldwide · 2023 (survey winter 2022) |
| 2024: managing cloud spend, the top challenge | 84% | Cloud decision-makers and users (technical professionals and executive leaders) worldwide, Flexera State of the Cloud survey · Worldwide · 2024 (survey winter 2023) |
| 2025: managing cloud spend, the top challenge | 84% | Cloud decision-makers and users (technical professionals and executive leaders) worldwide, Flexera State of the Cloud survey · Worldwide · 2025 (survey winter 2024) |
| 2026: managing cloud spend, the top challenge | 85% | Cloud decision-makers and users (technical professionals and executive leaders) worldwide, Flexera State of the Cloud survey · Worldwide · 2026 (survey winter 2025) |
| 2020: top cloud migration challenge | No. 1 | Cloud decision-makers and users (technical professionals and executive leaders) worldwide, Flexera State of the Cloud survey · Worldwide · 2020 |
| 2021: application dependency mapping, a migration challenge | 51% | Cloud decision-makers and users (technical professionals and executive leaders) worldwide, Flexera State of the Cloud survey · Worldwide · 2021 (survey Q4 2020) |
| 2022: understanding application dependencies, the top migration challenge | 53% | Cloud decision-makers and users (technical professionals and executive leaders) worldwide, Flexera State of the Cloud survey · Worldwide · 2022 (survey Q4 2021) |
| 2023: application dependency mapping, the biggest migration challenge | 49% | Cloud decision-makers and users (technical professionals and executive leaders) worldwide, Flexera State of the Cloud survey · Worldwide · 2023 (survey winter 2022) |
| 2024: understanding application dependencies, the top migration challenge | 54% | Cloud decision-makers and users (technical professionals and executive leaders) worldwide, Flexera State of the Cloud survey · Worldwide · 2024 (survey winter 2023) |
| 2026: optimising costs after migration (fell from third to fifth) | 39% | Cloud decision-makers and users (technical professionals and executive leaders) worldwide, Flexera State of the Cloud survey · Worldwide · 2026 (survey winter 2025) |

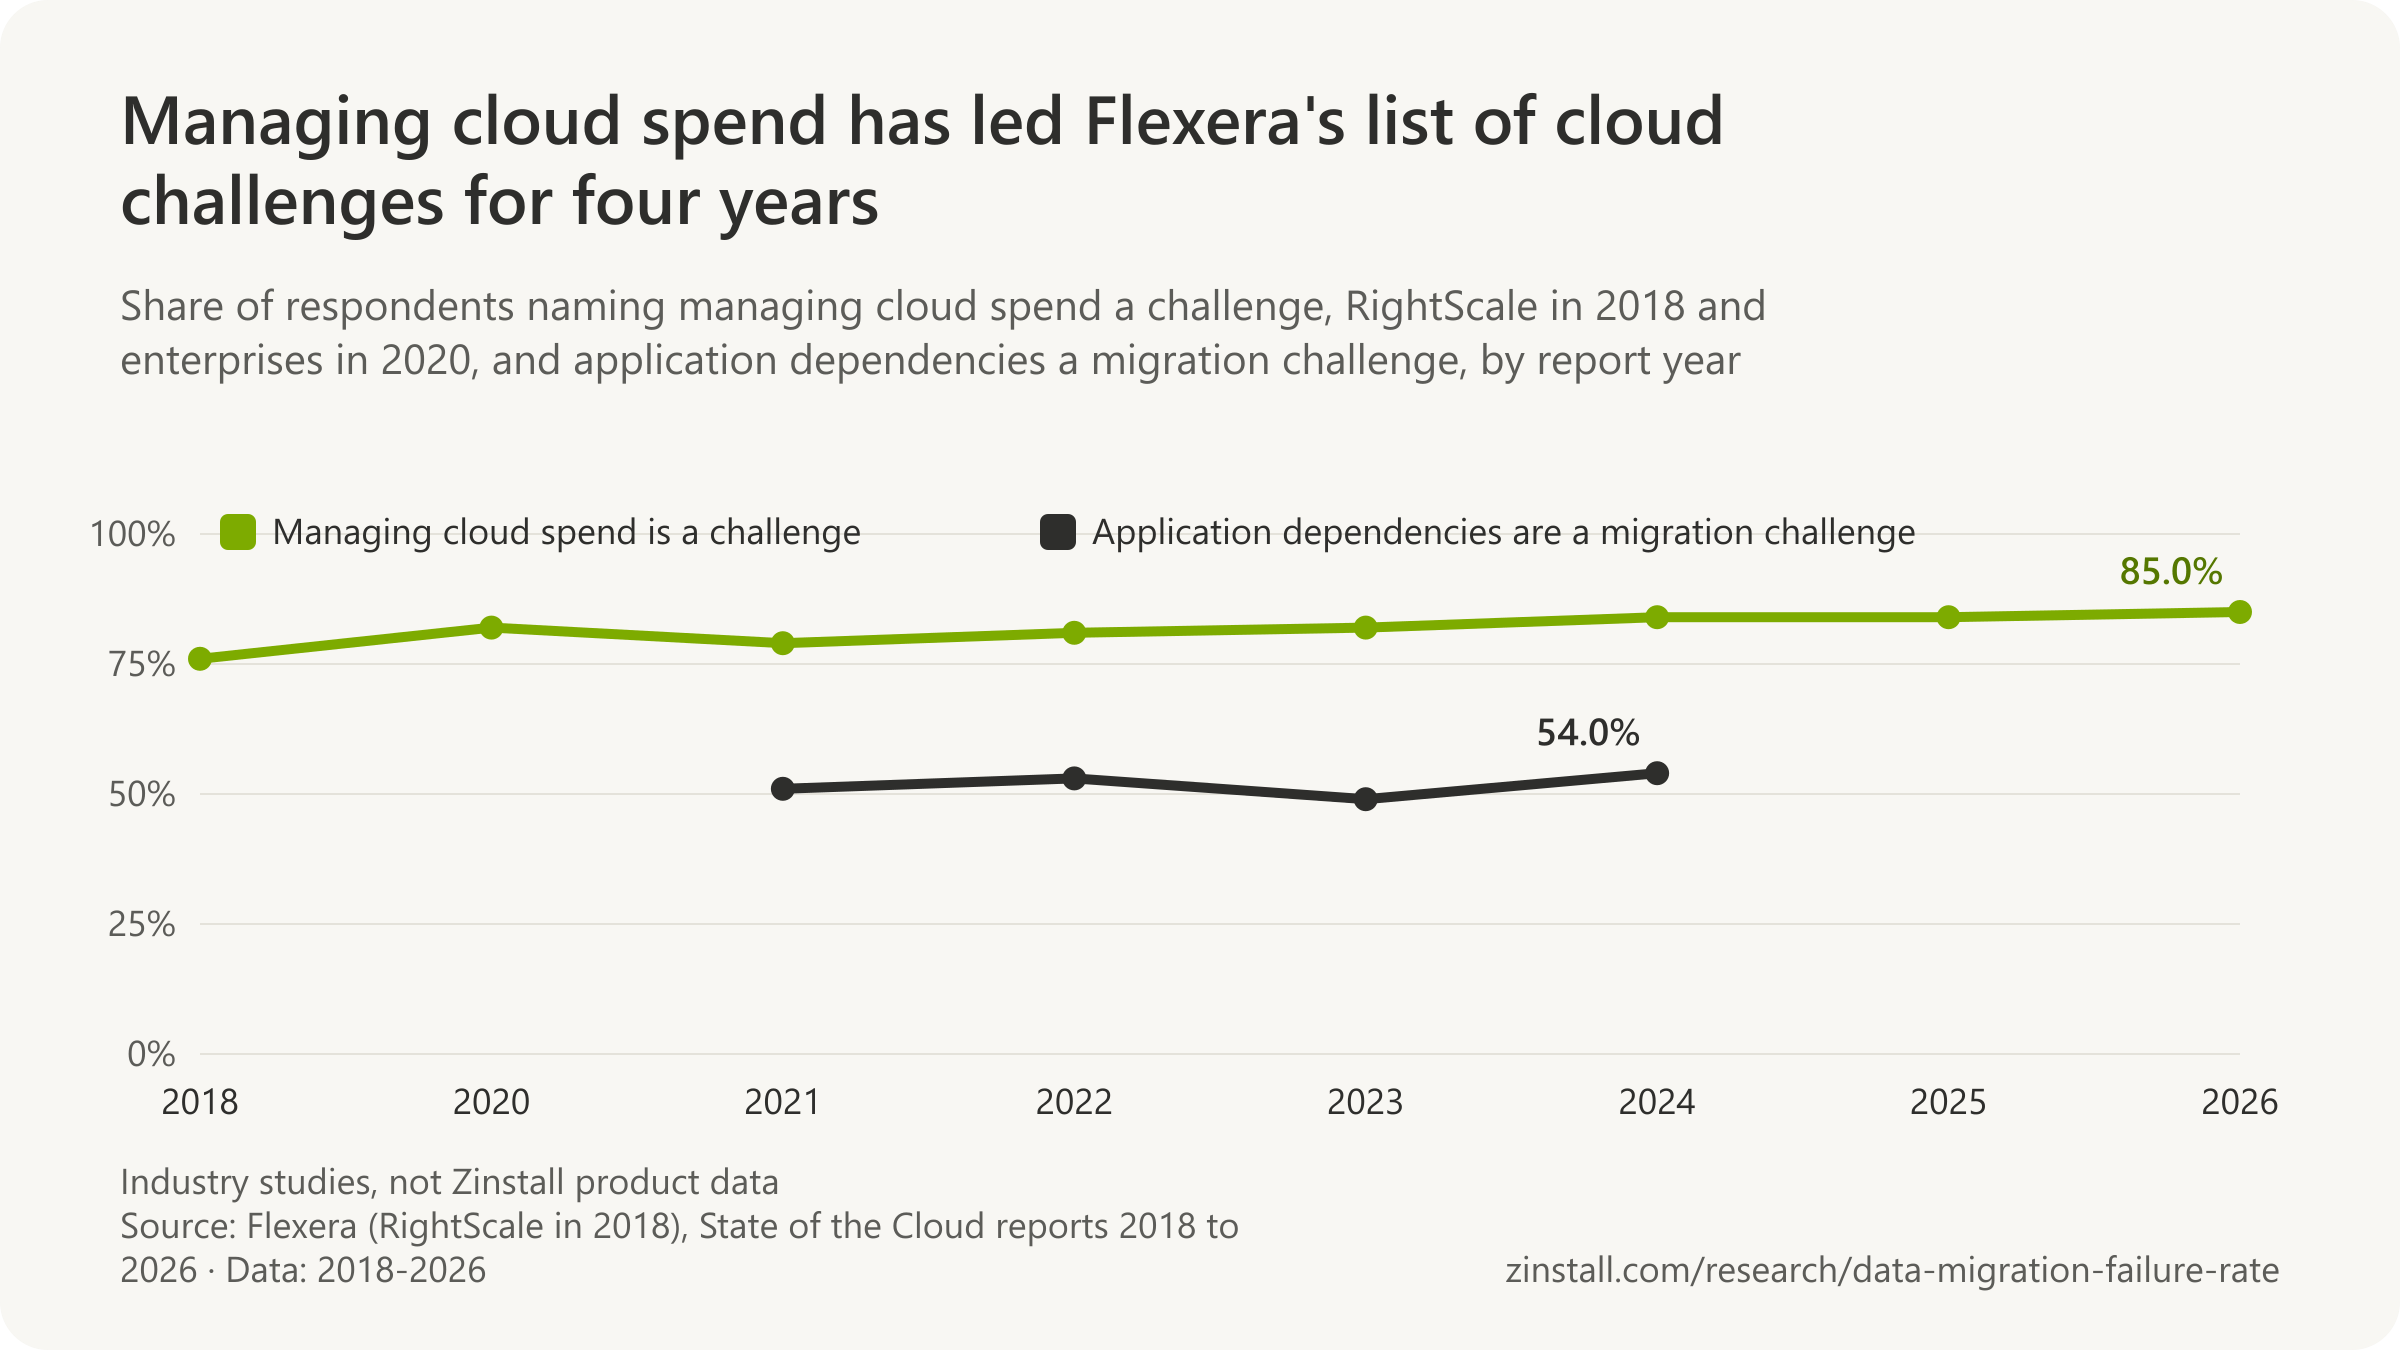
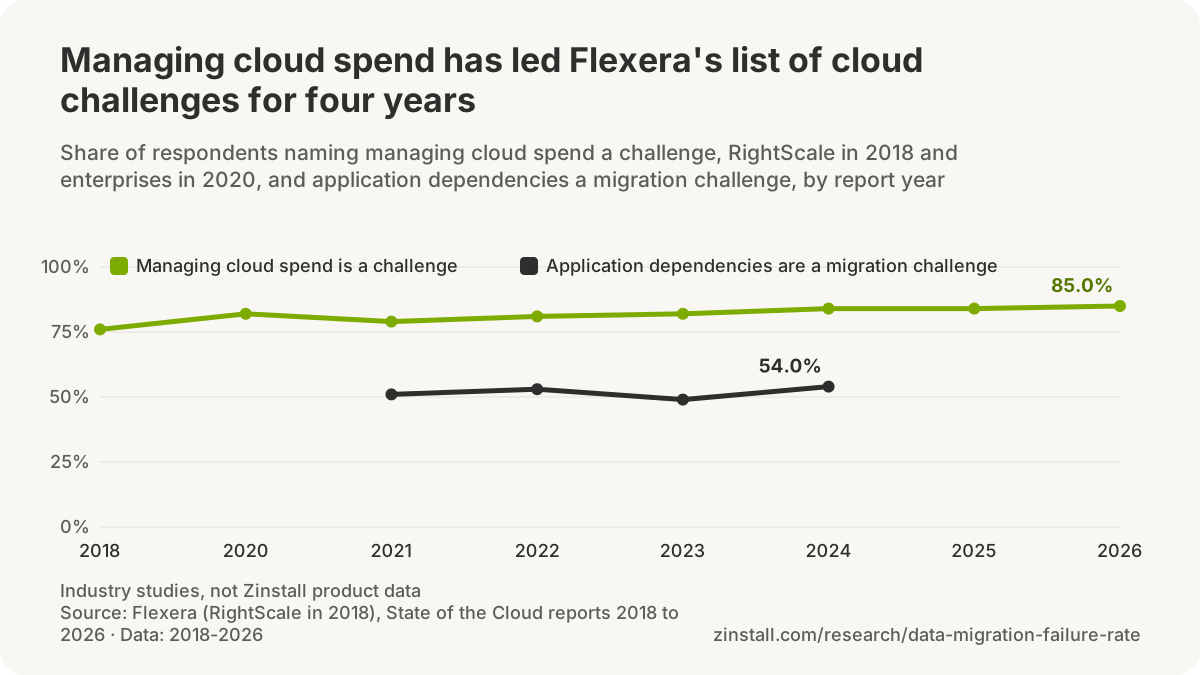
| Survey, year and what was asked | Share | Scope |
|---|---|---|
| 2019, IHS Markit for Fortinet, 350 companies: had ever moved at least one application back out of public cloud | 74% | 350 companies surveyed by IHS Markit in a study sponsored by Fortinet · Worldwide · 2019 |
| 2019, Vanson Bourne for Nutanix, 2,650 IT decision-makers: currently moving some applications back on premises | 73% | 2,650 IT decision-makers in 24 countries surveyed by Vanson Bourne for Nutanix (Enterprise Cloud Index 2019) · Worldwide (24 countries) · 2019 |
| 2020, Barclays CIO survey (via trade press): planning to move some workloads back | 43% | Enterprise CIOs in the Barclays CIO Survey (sample not public) · Worldwide (Barclays CIO panel) · late 2020 |
| 2024, Barclays CIO survey (via trade press): planning to move some workloads back | 83% | Enterprise CIOs in the Barclays CIO Survey (sample not public) · Worldwide (Barclays CIO panel) · 2024 (survey 2024) |
| 2024, IDC: expecting some repatriation of compute or storage in the next twelve months | about 80% | Respondents to IDC's workload repatriation survey (sample not public) · Worldwide · 2024 (report June 2024) |
| 2024, IDC: planning full repatriation | 8-9% | Companies in IDC's Server and Storage Workloads Survey · Worldwide · 2024 (survey cited October 2024) |
| 2022, IDG for Supermicro: expecting to move workloads back | 71% | IT respondents to an IDG survey sponsored by Supermicro (sample not given) · Worldwide · 2022 |
| 2025, Flexera, 759 respondents: share of cloud workloads already repatriated | 21% | Cloud decision-makers and users at organisations with 100 to 10,000+ employees (Flexera State of the Cloud survey) · Worldwide · 2024-Q4 |
| Firm, measure and year | US dollars, billions | Scope |
|---|---|---|
| Gartner, worldwide end-user spending on public cloud services, 2024 | $595.7B | Worldwide public cloud services market (Gartner forecast, all segments) · Worldwide · 2024 |
| Gartner, the same measure, 2025 (forecast of November 2024) | $723.4B | Worldwide public cloud services market (Gartner forecast, all segments) · Worldwide · 2025 (forecast made November 2024) |
| Gartner, public cloud services market, 2029 (forecast of September 2025) | $1.48T | Worldwide public cloud services market (Gartner forecast) · Worldwide · 2029 (forecast published September 2025) |
| IDC, global public cloud spending, 2026 (forecast of March 2026) | >$1T | Global public cloud services market, IDC Worldwide Software and Public Cloud Services Spending Guide (28 industries, 53 countries) · Worldwide · 2026 (forecast published March 2026) |
| Roundup, year and figure | As published | Scope |
|---|---|---|
| Opsio, 2025: public cloud spend in 2025 (Gartner's November 2024 forecast, correctly attributed) | $723.4B | Worldwide public cloud services market (Gartner forecast) · Worldwide · 2025 |
| Opsio, 2025: managing cloud spend a challenge, labelled 'Flexera (2025)' (the 2023 edition's figure) | 82% | Cloud decision-makers and users (technical professionals and executive leaders) worldwide, Flexera State of the Cloud survey · Worldwide · 2025 (restating 2023) |
| Opsio, 2025: organisations meeting cloud cost targets (no survey named) | 40% | Unspecified · Worldwide · 2025 |
| Opsio, 2025: 'reported success rate' of well-scoped cloud migrations (no survey named; DuploCloud repeats it) | 89% | Unspecified · Worldwide · 2025 |
| DuploCloud, 2025: cloud migration market by 2025 (source unnamed) | $20.5B | Market-research estimate, publisher not named · Worldwide · 2025 |
| DuploCloud, 2025: 'global public cloud infrastructure spend' in 2024 (matches Gartner's total for all public cloud services) | $592B | Unnamed source · Worldwide · 2024 |
| Auvik, 2026: 'cloud migration services market' in 2026, growing to $143.7 billion by 2035 (source unnamed) | $19.28B | Market-research estimate, publisher not named · Worldwide · 2026 |
| Auvik, 2026: managing cloud spend a top challenge (Flexera 2025, correctly attributed) | 84% | Cloud decision-makers and users (technical professionals and executive leaders) worldwide, Flexera State of the Cloud survey · Worldwide · 2026 (restating 2025) |
| Prioxis, 2026: cloud spend wasted (Flexera 2026, correctly attributed) | 29% | Cloud decision-makers and users (technical professionals and executive leaders) worldwide, Flexera State of the Cloud survey · Worldwide · 2026 |
| Prioxis, 2026: 'overall global cloud market' in 2026 (two unnamed sources) | $1,100B | Unnamed sources [1 | 2] · Worldwide · 2026 |
Sources: Accenture (2018, 2020); Flexera (2019-2026); Unisys (2019); IDC (2022-2026); Fortinet; Nutanix; Barclays; Gartner (2021, 2024, 2025); HashiCorp (2022, 2024); Virtana; Andreessen Horowitz; 37signals; RightScale (2016, 2017, 2018); Intelligent CIO; Channelnomics; Auxis; Onix; IDG; Opsio; DuploCloud; Auvik; Prioxis
How often do PC and Windows migrations go wrong?
Industry studies of migration projects; none of these figures measures Zinstall's products.
32% of organisations in an industry survey had lost data while moving between devices or upgrading an operating system (Kroll Ontrack, 2016).

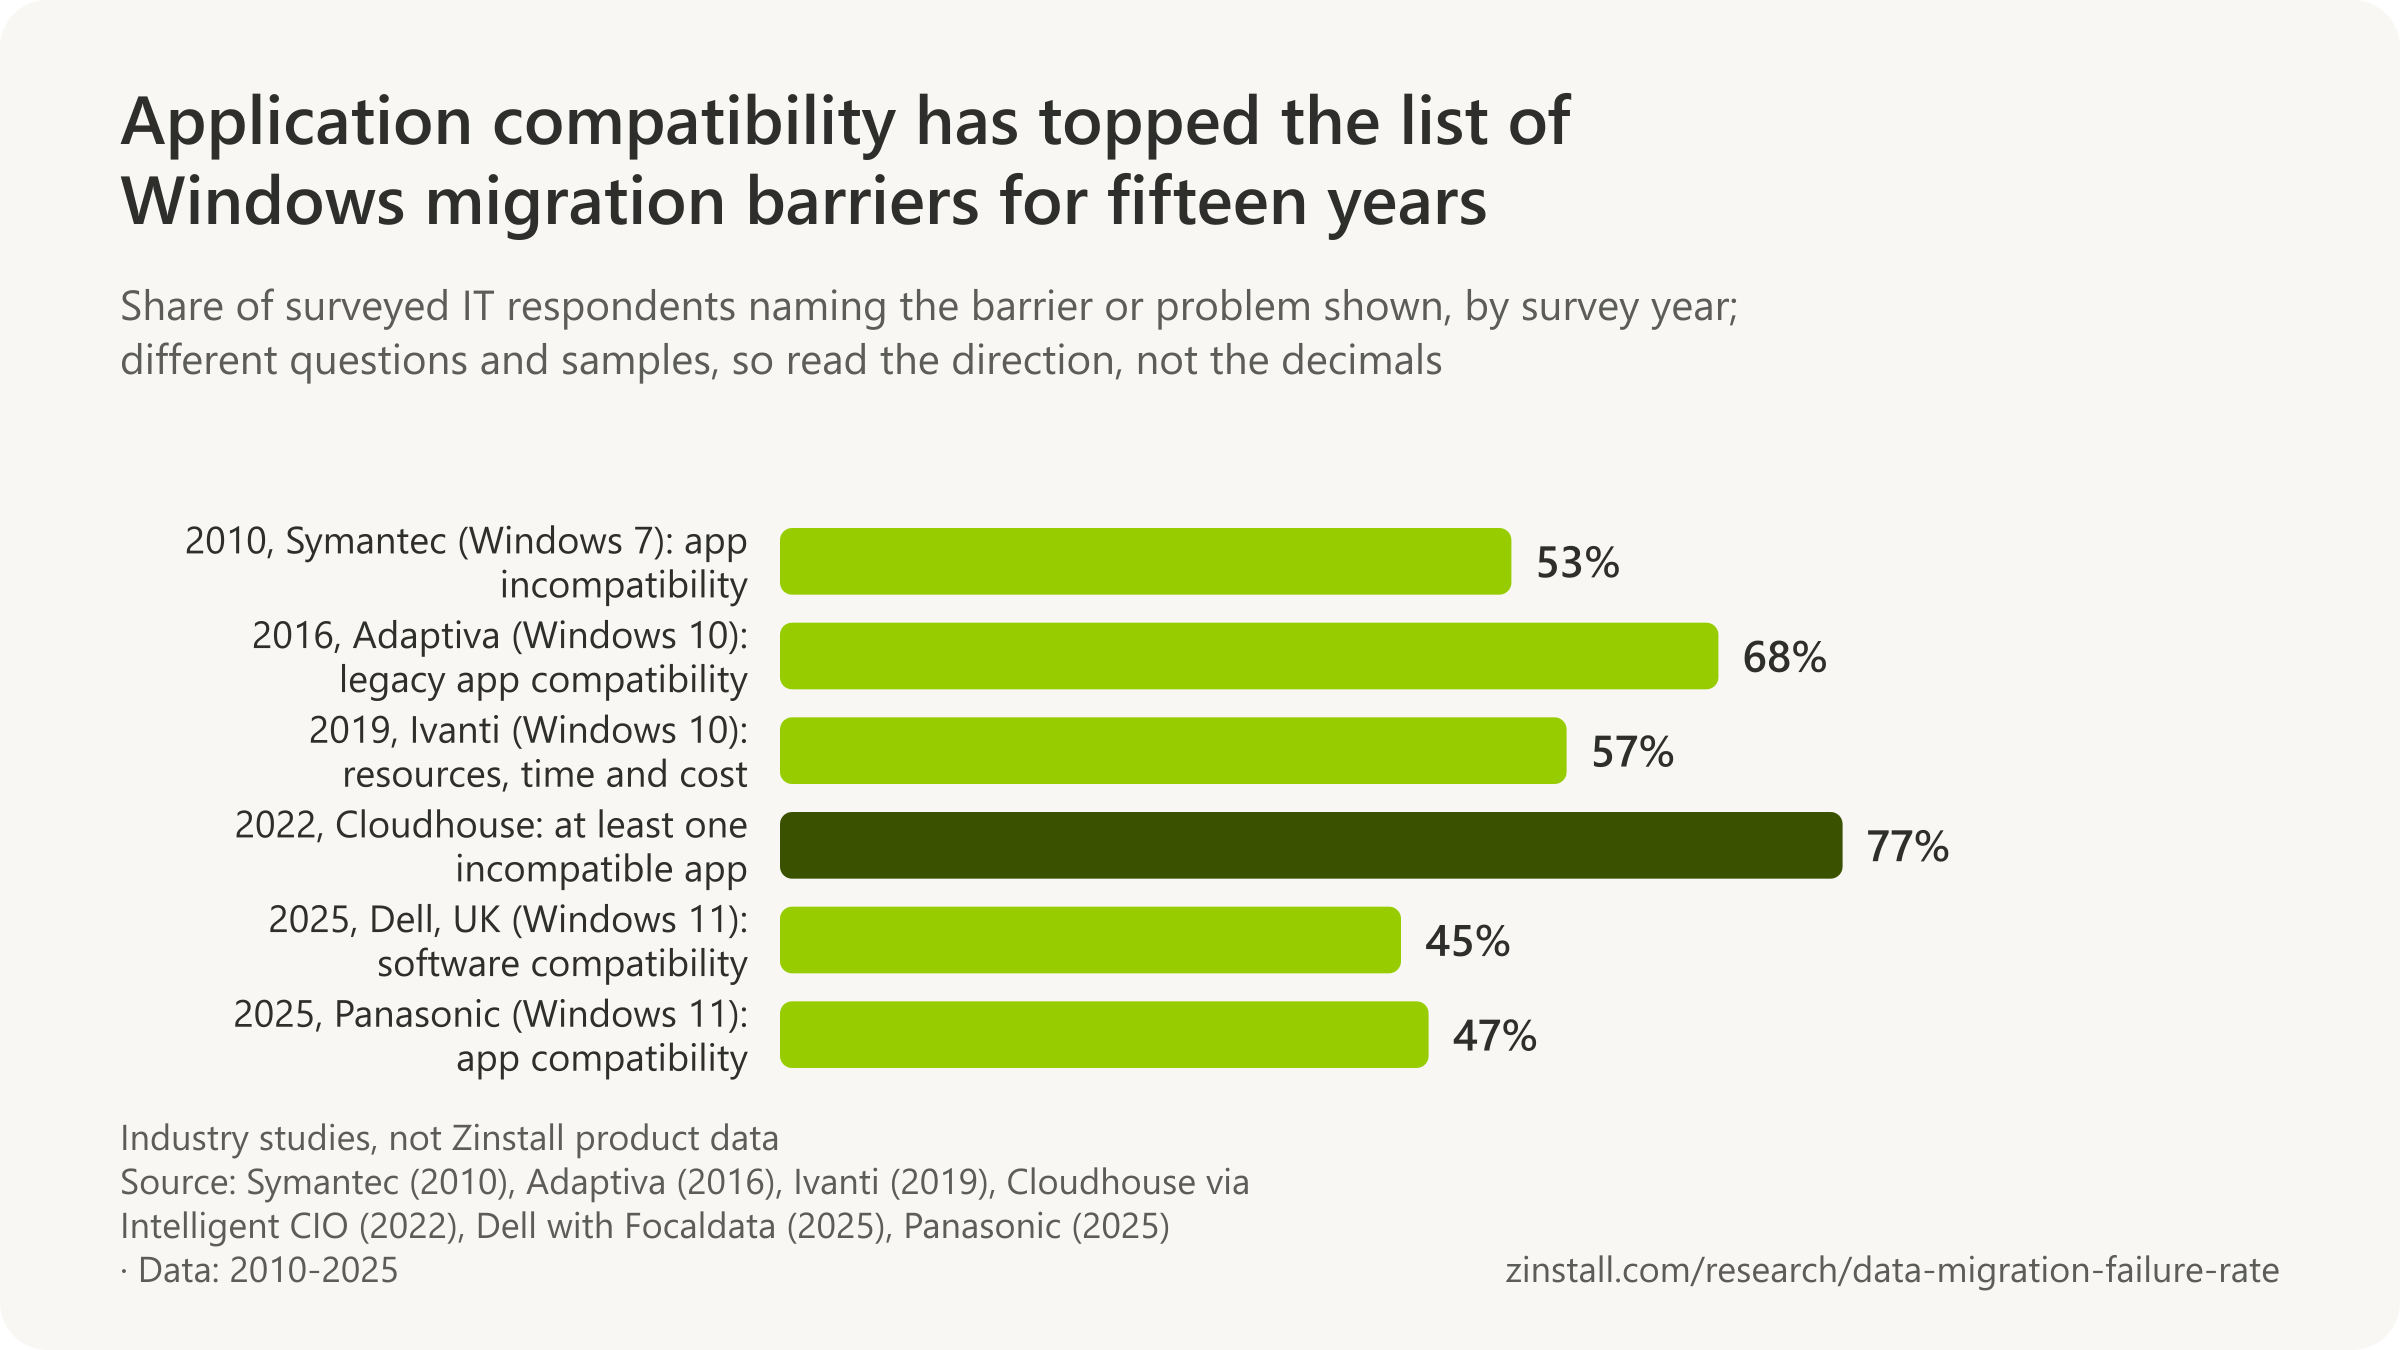
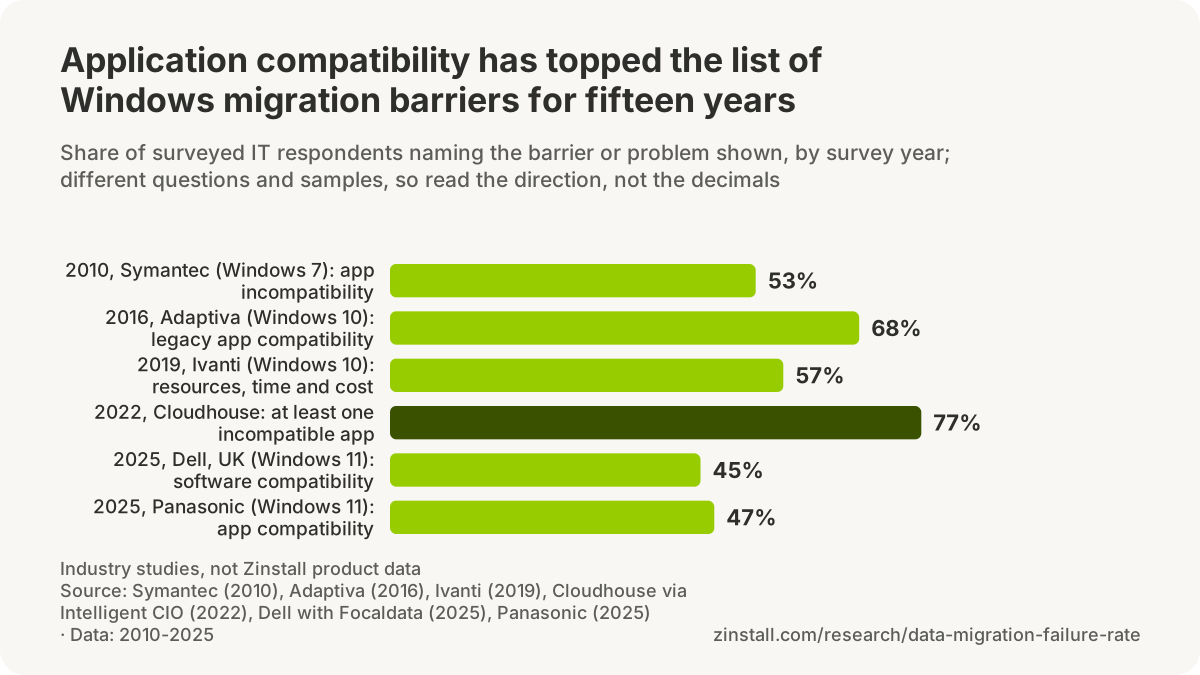
- 53% of IT teams that moved to Windows 7 blamed their delays on application incompatibility, in 2010.
- Of those who lost data, 75% could not restore all of it and 23% recovered none, though 57% had a backup.
- 12% of consumers who upgraded to Windows 10 rolled back to their previous Windows, in a 2016 member survey.
- Migrating one existing machine to Windows 7 took 5 hours on average, against 4 for a fresh install.
- 37% of IT respondents expected their full Windows 10 migration to take over a year, in 2017.
| Audit and population | Share |
|---|---|
| 2024, ControlUp, enterprise endpoints not yet on Windows 11: already able to run it | 88% |
| 2024, ControlUp: needing replacement | 11% |
| 2025, ControlUp, healthcare endpoints: needing replacement | 19% vs 3% |
| 2026, Lansweeper, remaining Windows 10 devices: failing the Windows 11 hardware requirements | 2.8% |
| 2026, Lansweeper, healthcare Windows 10 devices: unable to move | 1.1% |
| 2022, Nexthink, managed devices: ready for Windows 11 | 40% |
| 2022, Nexthink: not ready at all | 35% not ready, 25% almost |
| 2018 to 2025, Microsoft App Assure, enterprise applications: compatible with the next Windows | 99.7% |
Sources: Kroll Ontrack; Symantec (2010a, 2010b); Which?; Adaptiva (2017, 2016); ControlUp (2025, 2024); Lansweeper; Nexthink; Microsoft; Ivanti; Cloudhouse; Dell Technologies; Panasonic TOUGHBOOK
More statistics (109)
32% of organisations had lost data while migrating between devices or upgrading operating systems, among 572 Kroll Ontrack data recovery customers surveyed in February 2016 (Kroll Ontrack, 2016).
Moving a fleet of PCs to a new Windows, or a person to a new computer, is a migration too, and the surveys that measure it are mostly commissioned by the companies that sell the tools or the hardware. Read with that in mind, they agree on three things. Application compatibility is the barrier IT teams name first in every Windows generation, from the Windows 7 move to the Windows 11 one, even though Microsoft's own compatibility programme finds almost every enterprise application runs. Planning time is traded against downtime: the teams that prepared most reported the least disruption. And data gets lost on the way more often than anyone plans for, which is the one finding here that comes from a data-recovery firm rather than a software vendor. The readiness audits at the end of the section are the bridge to the Windows 11 adoption page: most machines that had not moved could have.
- 53% of 1,360 IT respondents at businesses that had migrated to Windows 7 associated their delays with application incompatibility, ahead of hardware incompatibility (44%) and budget (40%), in 2010 (Symantec survey via Redmond Magazine, 2010).
- 5 hours was the average time to migrate each existing machine from an old operating system to Windows 7, falling to 4 hours for a fresh install on a new machine, among 1,360 IT managers surveyed for Symantec in 2010 (Symantec survey via TechCentral.ie, 2010).
- 2 hours offline was the user downtime at organisations whose IT spent 20 hours preparing for Windows 7, against 6 hours where IT spent nine hours, among more than 1,300 IT managers surveyed by Symantec in 2010 (Symantec, 2010).
- 20 hours of IT preparation on average was the top tier's investment in a Windows 7 migration, against nine hours for the bottom tier, among more than 1,300 IT managers surveyed by Symantec in 2010 (Symantec, 2010).
- 60% of users were extremely satisfied after the migration at top-tier organisations (20 hours of IT preparation), against 25% at bottom-tier organisations (nine hours), among more than 1,300 IT managers surveyed by Symantec in 2010 (Symantec, 2010).
- 78% of IT teams said the actual Windows 7 migration process was smooth, among more than 1,300 IT managers surveyed by Symantec in 2010 (Symantec, 2010).
- 71% of more than 1,300 IT managers surveyed by Symantec simply replaced applications that were not compatible with Windows 7, in 2010 (Symantec, 2010).
- More than 1,300 IT managers worldwide answered Symantec's 2010 Windows 7 Migration Survey, which reported their experiences of completed migrations in 2010 (Symantec, 2010).
- 77% of 200 surveyed UK and US CIOs said their organisation had at least one application not compatible with the latest version of Windows, in June 2022 (Cloudhouse survey via Intelligent CIO, 2022).
- 89% of 200 surveyed UK and US CIOs said up to a quarter (25%) of all their applications were incompatible with the latest version of Windows, in June 2022 (Cloudhouse survey via Intelligent CIO, 2022).
- 24% of 200 surveyed UK and US CIOs were not at all or not very confident of upgrading their platforms to be 100% compatible with the latest Windows, in June 2022 (Cloudhouse survey via Intelligent CIO, 2022).
- 20% of 200 surveyed UK and US CIOs had a comprehensive plan for application compatibility with newer Windows versions, in June 2022 (Cloudhouse survey via Intelligent CIO, 2022).
- Over 99.7% was the Windows 10 application compatibility rate for enterprise organisations, including line-of-business apps, in Microsoft's App Assure data cited on its Windows 11 planning page in 2025 (Microsoft, 2025).
- Almost 800,000 apps had been evaluated by Microsoft's App Assure service since 2018, according to Microsoft's Windows 11 planning page in 2025 (Microsoft, 2025).
- 3,307 of 837,699 customer apps evaluated by Microsoft's App Assure service needed some level of remediation, as of October 2021 (Microsoft, 2021).
- 190,000 devices were upgraded to Windows 11 across Microsoft in five weeks, the fastest operating-system deployment in the company's history, reported in 2022 (Microsoft Inside Track, 2022).
- 75% of respondents who lost data could not restore all of it, and 23% recovered none, although 57% had a backup solution, among 572 Kroll Ontrack customers surveyed in February 2016 (Kroll Ontrack, 2016).
- 50% of respondents said they lost data when migrating a desktop or laptop to new software or platforms, among 572 Kroll Ontrack customers surveyed in February 2016 (Kroll Ontrack, 2016).
- 39% named upgrading the operating system as the riskiest desktop or laptop change for data loss, ahead of reimaging (22%), physically migrating hardware (20%) and upgrading hardware (17%), among 572 Kroll Ontrack customers surveyed in 2016 (Kroll Ontrack, 2016).
- 17% of respondents with a backup said it was not current when data was lost during a migration or OS upgrade, 15% said it was not working, 14% said the device was not included and 11% said the media was corrupted, among 572 Kroll Ontrack customers surveyed in 2016 (Kroll Ontrack, 2016).
- 12% of 2,500 Which? members who had upgraded to Windows 10 had rolled back to their previous version of Windows, in Which?'s June 2016 survey of 5,500 members (Which? via Silicon UK, 2016).
- More than half of the 12% of Which? members who rolled back from Windows 10 did so because the upgrade had adversely affected their PC (printers, Wi-Fi, speakers, lost files, email sync), in Which?'s June 2016 survey (Which? via Silicon UK, 2016).
- 57% of more than 5,000 Windows XP users surveyed by IObit said losing important data was their biggest worry about upgrading from XP, in April 2014 (IObit, 2014).
- 65% of IT professionals whose companies had already upgraded rated the move to Windows 10 'somewhat to extremely challenging', among more than 300 surveyed by Adaptiva in 2016 (Adaptiva via CIO Dive, 2016).
- 57% of 446 respondents expected migrating a single PC to Windows 10 to take between two and four hours, in Adaptiva's May 2017 enterprise survey (Adaptiva via RCP, 2017).
- 37% of 446 respondents expected their full Windows 10 migration to take over one year, and 22% seven to 12 months, in Adaptiva's May 2017 enterprise survey (Adaptiva via RCP, 2017).
- 39% of more than 500 IT professionals surveyed by Ivanti would not complete their Windows 10 migration before Windows 7's January 2020 end of support, in October 2019 (Ivanti via Help Net Security, 2019).
- 59% of more than 500 IT professionals surveyed by Ivanti had still not migrated all their users to Windows 10 ten weeks before Windows 7 support ended, in October 2019 (Ivanti via Help Net Security, 2019).
- 67% of businesses running Windows 7 planned to migrate all their machines off it before the January 2020 end-of-support date, and 25% planned to migrate after the deadline, among 489 IT decision makers surveyed by Spiceworks in June 2019 (Spiceworks, 2019).
- 79% of organisations still ran at least one instance of Windows 7 six months before its end of support, in Spiceworks' April 2019 deployment data (Spiceworks, 2019).
- 45% of 1,000 UK IT decision makers cited software compatibility issues as a barrier to the Windows 11 transition, the most cited barrier, in Dell's June 2025 Focaldata survey (Dell, 2025).
- 20% of UK businesses had not yet started transitioning to Windows 11 less than four months before the deadline, in Dell's June 2025 Focaldata survey of 1,000 IT decision makers (Dell via TechRadar, 2025).
- 62% of devices had to be upgraded or replaced completely to support Windows 11, among 200 UK and German enterprise decision makers surveyed for Panasonic TOUGHBOOK in March 2025 (Panasonic via Enterprise Times, 2025).
- 42% of UK enterprise decision makers said their Windows 11 migration was taking longer than planned, level with application compatibility (42%) and device lifecycle timing (42%), among 100 UK respondents to Panasonic TOUGHBOOK's 2025 survey (Panasonic, 2025).
- 30% of HP's PC installed base was still on Windows 10 seven months after its end of support, according to HP's CFO on its fiscal Q2 2026 earnings call (HP via The Register, 2026).
- 88% of the unmigrated enterprise endpoints were ready for Windows 11, among over 750,000 devices managed by ControlUp in August 2024 (ControlUp, 2024).
- 2.8% of remaining Windows 10 devices across Lansweeper's customer sites sat on hardware that could not meet Windows 11's requirements at all, so most holdouts were migrations not done rather than impossible, in July 2026 (Lansweeper, 2026).
- 1.2% of Windows 11 devices experienced system crashes against 0.6% of Windows 10 devices, and 9.9% versus 8.5% hard resets, across Nexthink customer endpoints in 2025 (Nexthink, 2025).
- 41% of 2,156 Asia Pacific SMBs surveyed cited fear of application compatibility, and 27% lack of budget, as the key reason for not replacing older PCs, in Techaisle's 2018 study for Microsoft and Intel (Techaisle, 2018).
- 39% of 1,200 PC users felt that migrating from an old PC to a new one was reason enough to delay buying a new PC, in an Intel-sponsored survey cited by Laplink in 2011 (Laplink press release, 2011).
- 1 in 5 PC buyers was so concerned about setting up a new PC that they would put off buying one, according to Laplink's own research on PC buyer habits cited in October 2012 (Laplink press release, 2012).
- 50% of 200 surveyed UK and US CIOs felt a significant amount of work remained to modernise applications for newer Windows versions, in June 2022 (Cloudhouse survey via Intelligent CIO, 2022).
- 32% of 200 surveyed UK and US CIOs said 16% to 25% of their applications were critical to business operations, in June 2022 (Cloudhouse survey via Intelligent CIO, 2022).
- 200 CIOs at UK and US enterprises were polled for Cloudhouse's 2022 compatibility survey, and 55% planned to raise their 2022 application modernisation budget by more than a quarter (Cloudhouse survey via ERP Today, 2022).
- 29% of 200 surveyed UK and US CIOs with a plan of action said their primary strategy was to replace an incompatible application to work with a new Windows version, in June 2022 (Cloudhouse survey via ERP Today, 2022).
- 52% of IT managers in Symantec's 2010 Windows 7 survey cited application incompatibility as the biggest cause of migration delays, in TechCentral.ie's report (TechCentral.ie, 2010).
- 79% of IT managers in Symantec's 2010 Windows 7 survey said performance had somewhat or significantly increased after migration, in TechCentral.ie's report, against 80% in Redmond Magazine's (TechCentral.ie, 2010).
- Reinstalling applications was one of the three most time-consuming Windows 7 migration tasks, with planning and the upgrade itself, reported by 1,360 businesses surveyed for Symantec in 2010 (ESJ, 2010).
- Days or even months was how long it could take to set up a new PC with the data, e-mail, contacts, bookmarks and settings from an old one, according to Intel's 2002 announcement of the PC Migration Work Group (Intel, 2002).
- 12% of Windows 10 upgraders had rolled back 'because of the update's negative impact on their PCs' in Computer Weekly's account of Which?'s 2016 survey, whereas Silicon UK reported that more than half of the 12% gave that reason (Computer Weekly, 2016).
- Most users who rolled back from Windows 10 did so within the first several days, Microsoft said when it cut the rollback window from 30 to 10 days in August 2016, without publishing a rollback rate (Microsoft via Computerworld, 2016).
- 53% of respondents said they lost data when migrating to a new mobile device, among 572 Kroll Ontrack customers surveyed in February 2016 (Kroll Ontrack, 2016).
- 38% of more than 5,000 Windows XP users surveyed by IObit said the system upgrade process was time consuming, in April 2014 (IObit, 2014).
- 4,212,000 manual hours at minimum would be needed to upgrade the 60% of 3.12 million analysed devices that were not Windows 11 compatible, at 15 minutes per manual task, in Nexthink's 2022 estimate (Nexthink, 2022).
- 82% of devices not on Windows 11, 88% of them ready and 11% needing replacement were ControlUp's August 2024 findings as restated by ITPro, which added Cloudhouse's view that Windows 10 migrations were 'often lengthy and disruptive' because of legacy applications (ITPro, 2024).
- 89% of UK respondents expected Windows 11 migration costs to increase if not completed before October 2025, against 43% of German respondents, among 200 enterprise decision makers surveyed for Panasonic TOUGHBOOK in March 2025 (Panasonic via Enterprise Times, 2025).
- 56% of devices in Germany would need replacing or upgrading for Windows 11, against 68% in the UK, among 200 enterprise decision makers surveyed for Panasonic TOUGHBOOK in 2025 (Panasonic, 2025).
- 2 times the Windows 10 rate was how fast people accepted the Windows 11 upgrade offer, Microsoft's Panos Panay said in January 2022, without giving the underlying figures (Microsoft via The Register, 2022).
| Survey, year and barrier | Share of respondents | Scope |
|---|---|---|
| 2010, Symantec, over 1,300 IT managers (Windows 7): application incompatibility caused the biggest delays | 53% | 1,360 respondents worldwide at businesses that had completed a Windows 7 migration (phone survey by Applied Research for Symantec, August 2010; median employer size 1,000 to 2,499 employees) · Worldwide · 2010-08 |
| 2010, Symantec: hardware incompatibility | 44% | 1,360 respondents worldwide at businesses that had completed a Windows 7 migration (phone survey by Applied Research for Symantec, August 2010; median employer size 1,000 to 2,499 employees) · Worldwide · 2010-08 |
| 2010, Symantec: budget constraints | 40% | 1,360 respondents worldwide at businesses that had completed a Windows 7 migration (phone survey by Applied Research for Symantec, August 2010; median employer size 1,000 to 2,499 employees) · Worldwide · 2010-08 |
| 2016, Adaptiva, enterprise IT (Windows 10): legacy application compatibility | 68% | more than 300 IT professionals at small, mid-sized and large companies surveyed by Adaptiva around the Windows 10 Anniversary Update, 2016 · United States (mainly) · 2016-07 |
| 2019, Ivanti, IT professionals (Windows 10): resources, time and migration cost | 57% | more than 500 IT professionals surveyed online by Ivanti, 2019 · Worldwide · 2019-10 |
| 2022, Cloudhouse, 200 UK and US CIOs: have an application incompatible with the latest Windows | 77% | 200 CIOs at enterprise organisations in the UK and US (survey commissioned by Cloudhouse, June 2022) · UK and US · 2022-06 |
| 2018, Techaisle for Microsoft, SMBs: kept older PCs for fear of application compatibility | 41% | 2,156 SMB IT and business decision makers in Australia, India, Indonesia, Japan and South Korea (Techaisle 'Make the Shift' study for Microsoft and Intel, August 2018) · Asia Pacific (Australia, India, Indonesia, Japan, South Korea) · 2018-08 |
| 2025, Dell (Focaldata), UK IT decision-makers (Windows 11): software compatibility the top barrier | 45% | 1,000 UK IT decision makers (53% at businesses with 251+ employees, 32% 51 to 250, 15% 1 to 50) surveyed by Focaldata for Dell, 3 to 9 June 2025 · United Kingdom · 2025-06 |
| 2025, Dell: hardware compatibility | 34% / 32% | 1,000 UK IT decision makers (53% at businesses with 251+ employees, 32% 51 to 250, 15% 1 to 50) surveyed by Focaldata for Dell, 3 to 9 June 2025 · United Kingdom · 2025-06 |
| 2025, Panasonic, UK and German decision-makers (Windows 11): application compatibility | 47% | 200 decision makers (100 in Germany, 100 in the UK) at organisations with over 1,000 employees undertaking a Windows 11 migration, surveyed in March 2025 for Panasonic TOUGHBOOK ('Navigating the Shift' whitepaper) · United Kingdom and Germany · 2025-03 |
| 2025, Panasonic, Germany: device downtime, then application compatibility | 54% / 52% | 200 decision makers (100 in Germany, 100 in the UK) at organisations with over 1,000 employees undertaking a Windows 11 migration, surveyed in March 2025 for Panasonic TOUGHBOOK ('Navigating the Shift' whitepaper) · Germany · 2025-03 |
| 2025, Panasonic, UK: migration taking longer than planned | 42% | 200 decision makers (100 in Germany, 100 in the UK) at organisations with over 1,000 employees undertaking a Windows 11 migration, surveyed in March 2025 for Panasonic TOUGHBOOK ('Navigating the Shift' whitepaper) · United Kingdom · 2025-03 |
| 2013, Techaisle: citing lack of budget for not replacing older PCs | 47% | 736 small businesses (1 to 99 employees) in Brazil, China, Germany, India, Russia and the United States (Intel Small Business PC Refresh Study by Techaisle, April 2013) · Brazil, China, Germany, India, Russia, United States · 2013-04 |
| 2018, Techaisle for Microsoft and Intel, 2,156 Asia Pacific SMBs: barriers to newer devices | top 2 barriers | 2,156 SMB IT and business decision makers in Australia, India, Indonesia, Japan and South Korea (Techaisle 'Make the Shift' study for Microsoft and Intel, August 2018) · Asia Pacific (Australia, India, Indonesia, Japan, South Korea) · 2018-08 |
| Measure (IT managers surveyed in August 2010, as reported by Symantec and the trade press) | Figure | Scope |
|---|---|---|
| Respondents (median company size 1,000 to 2,499 employees) | 1,360 | 1,360 respondents worldwide at businesses that had completed a Windows 7 migration (phone survey by Applied Research for Symantec, August 2010; median employer size 1,000 to 2,499 employees) · Worldwide · 2010-08 |
| Migrated to Windows 7 immediately (the median waited six to twelve months) | 8% | 1,360 respondents worldwide at businesses that had completed a Windows 7 migration (phone survey by Applied Research for Symantec, August 2010; median employer size 1,000 to 2,499 employees) · Worldwide · 2010-08 |
| Were migrating from Windows Vista | 23% | 1,360 respondents worldwide at businesses that had completed a Windows 7 migration (phone survey by Applied Research for Symantec, August 2010; median employer size 1,000 to 2,499 employees) · Worldwide (Irish outlet) · 2010-08 |
| Ran into delays such as application incompatibility and budget constraints | most | More than 1,300 IT managers worldwide at businesses that had completed a Windows 7 migration (phone survey by Applied Research for Symantec, August 2010) · Worldwide · 2010-08 |
| Share of migration time spent planning, the most time-consuming task | 17% | 1,360 respondents worldwide at businesses that had completed a Windows 7 migration (phone survey by Applied Research for Symantec, August 2010; median employer size 1,000 to 2,499 employees) · Worldwide · 2010-08 |
| Share of effort spent reinstalling applications, the third most time-consuming | 10% | 1,360 respondents worldwide at businesses that had completed a Windows 7 migration (phone survey by Applied Research for Symantec, August 2010; median employer size 1,000 to 2,499 employees) · Worldwide · 2010-08 |
| IT staff typically involved (automation paid off from ten PCs) | half of IT staff | More than 1,300 IT managers worldwide at businesses that had completed a Windows 7 migration (phone survey by Applied Research for Symantec, August 2010) · Worldwide · 2010-08 |
| Automated the upgrade process | 54% | 1,360 respondents worldwide at businesses that had completed a Windows 7 migration (phone survey by Applied Research for Symantec, August 2010; median employer size 1,000 to 2,499 employees) · Worldwide · 2010-08 |
| Said planning helped and minimised the cost | 80%+ | More than 1,300 IT managers worldwide at businesses that had completed a Windows 7 migration (phone survey by Applied Research for Symantec, August 2010) · Worldwide · 2010-08 |
| Said it was easier than their last operating-system migration | 63% | More than 1,300 IT managers worldwide at businesses that had completed a Windows 7 migration (phone survey by Applied Research for Symantec, August 2010) · Worldwide · 2010-08 |
| Said it was more difficult than their last Windows migration | 11% | 1,360 respondents worldwide at businesses that had completed a Windows 7 migration (phone survey by Applied Research for Symantec, August 2010; median employer size 1,000 to 2,499 employees) · Worldwide · 2010-08 |
| Saw application virtualisation as a solution to compatibility problems | 69% | 1,360 respondents worldwide at businesses that had completed a Windows 7 migration (phone survey by Applied Research for Symantec, August 2010; median employer size 1,000 to 2,499 employees) · Worldwide · 2010-08 |
| Of the 62% who set ROI goals, achieved them | 90% | More than 1,300 IT managers worldwide at businesses that had completed a Windows 7 migration (phone survey by Applied Research for Symantec, August 2010) · Worldwide · 2010-08 |
| Said PC performance somewhat or significantly increased | 80% | 1,360 respondents worldwide at businesses that had completed a Windows 7 migration (phone survey by Applied Research for Symantec, August 2010; median employer size 1,000 to 2,499 employees) · Worldwide · 2010-08 |
| Top-tier companies upgraded within a year of release (52% of bottom-tier) | 71% vs 52% | 1,360 respondents worldwide at businesses that had completed a Windows 7 migration (phone survey by Applied Research for Symantec, August 2010; median employer size 1,000 to 2,499 employees) · Worldwide · 2010-08 |
| Survey, year and measure | Share | Scope |
|---|---|---|
| 2015, Spiceworks, over 500 IT professionals: planned to adopt Windows 10 within two years | 73% | more than 500 IT professionals worldwide in Spiceworks' community survey, April to May 2015 · Worldwide · 2015-04/2015-05 |
| 2015, Spiceworks: of those, ready to start within the first year | 40% | more than 500 IT professionals worldwide in Spiceworks' community survey, April to May 2015 · Worldwide · 2015-04/2015-05 |
| 2016, Adaptiva, over 300 IT professionals: expected to migrate to Windows 10 within a year | 64% | more than 300 IT professionals at small, mid-sized and large companies surveyed by Adaptiva around the Windows 10 Anniversary Update, 2016 · United States (mainly) · 2016-07 |
| 2017, Adaptiva, 446 respondents: had migrated a tenth or less of devices, two years after release | 46% | 446 respondents (about 47% IT system administrators and technical support staff, about 60% managing more than 1,000 systems) drawn from Adaptiva's customer base, May 2017 · United States (mainly) · 2017-05 |
| 2017, Adaptiva: more than halfway through (7.2% had expected to be, a year earlier) | 28% | 446 respondents (about 47% IT system administrators and technical support staff, about 60% managing more than 1,000 systems) drawn from Adaptiva's customer base, May 2017 · United States (mainly) · 2017-05 |
| 2019, Spiceworks: businesses with Windows XP on at least one device, five years after its end of support | 32% | organisations in Spiceworks' anonymised technology deployment data (April 2019), with a survey of 489 IT decision makers in North America (77%) and Europe (23%) in June 2019 · North America and Europe · 2019-04 |
| 2024, ControlUp, over 750,000 enterprise endpoints: not yet on Windows 11 | 82% | over 750,000 enterprise Windows endpoint devices managed by ControlUp, early August 2024 · Worldwide · 2024-08 |
| 2025, ControlUp, over a million endpoints: migration not complete, four months before end of support | 50% | more than one million enterprise Windows endpoint devices managed by ControlUp, June 2025 · Worldwide · 2025-06 |
| 2025, ControlUp, organisations with over 10,000 devices: migration complete | 42% | more than one million enterprise Windows endpoint devices managed by ControlUp, June 2025 · Worldwide · 2025-06 |
| 2025, Nexthink customer endpoints: fall in Windows 10 devices, May to August | -33% | Windows devices at Nexthink customer organisations · Worldwide · 2025-05/2025-08 |
| 2025, Dell (Focaldata), 1,000 UK IT decision-makers: migrating to or already on Windows 11 | 80% | 1,000 UK IT decision makers (53% at businesses with 251+ employees, 32% 51 to 250, 15% 1 to 50) surveyed by Focaldata for Dell, 3 to 9 June 2025 · United Kingdom · 2025-06 |
| 2025, Dell: in progress, and fully transitioned | 44% in progress, 35% done | 1,000 UK IT decision makers (53% at businesses with 251+ employees, 32% 51 to 250, 15% 1 to 50) surveyed by Focaldata for Dell, 3 to 9 June 2025 · United Kingdom · 2025-06 |
| 2025, Dell, small businesses: saw the transition as unnecessary | 29% | 1,000 UK IT decision makers (53% at businesses with 251+ employees, 32% 51 to 250, 15% 1 to 50) surveyed by Focaldata for Dell, 3 to 9 June 2025 · United Kingdom · 2025-06 |
| 2025, Panasonic, 200 UK and German decision-makers: had started the migration by March | 52% | 200 decision makers (100 in Germany, 100 in the UK) at organisations with over 1,000 employees undertaking a Windows 11 migration, surveyed in March 2025 for Panasonic TOUGHBOOK ('Navigating the Shift' whitepaper) · United Kingdom and Germany · 2025-03 |
| 2026, Lansweeper, nine months after end of support: Windows client devices still on Windows 10 | 16.9% | a subset of millions of Windows devices across tens of thousands of Lansweeper customer sites (HVMND Collective Intelligence data), July 2026 · Worldwide · 2026-07 |
| 2026, Lansweeper: Windows devices on any end-of-life version | 18.7% | a subset of millions of Windows devices across tens of thousands of Lansweeper customer sites (HVMND Collective Intelligence data), July 2026 · Worldwide · 2026-07 |
| Audit and population | Share | Scope |
|---|---|---|
| 2024, ControlUp, enterprise endpoints not yet on Windows 11: already able to run it | 88% | over 750,000 enterprise Windows endpoint devices managed by ControlUp, early August 2024 · Worldwide · 2024-08 |
| 2024, ControlUp: needing replacement | 11% | over 750,000 enterprise Windows endpoint devices managed by ControlUp, early August 2024 · Worldwide · 2024-08 |
| 2025, ControlUp, healthcare endpoints: needing replacement | 19% vs 3% | more than one million enterprise Windows endpoint devices managed by ControlUp, June 2025 · Worldwide · 2025-06 |
| 2026, Lansweeper, remaining Windows 10 devices: failing the Windows 11 hardware requirements | 2.8% | a subset of millions of Windows devices across tens of thousands of Lansweeper customer sites (HVMND Collective Intelligence data), July 2026 · Worldwide · 2026-07 |
| 2026, Lansweeper, healthcare Windows 10 devices: unable to move | 1.1% | a subset of millions of Windows devices across tens of thousands of Lansweeper customer sites (HVMND Collective Intelligence data), July 2026 · Worldwide · 2026-07 |
| 2022, Nexthink, managed devices: ready for Windows 11 | 40% | 3.12 million anonymised devices at 457 Nexthink customer organisations in 8 industries · Worldwide · 2022-05 |
| 2022, Nexthink: not ready at all | 35% not ready, 25% almost | 3.12 million anonymised devices at 457 Nexthink customer organisations in 8 industries · Worldwide · 2022-05 |
| 2018 to 2025, Microsoft App Assure, enterprise applications: compatible with the next Windows | 99.7% | apps evaluated by Microsoft's App Assure program for enterprise customers · Worldwide · 2018-09/2025-03 |
| Date and measure | Figure | Scope |
|---|---|---|
| October 2021: customer applications evaluated since September 2018 | 837,699 | customer apps submitted to Microsoft's App Assure service by commercial customers, 2018 to 2021 · Worldwide · 2018-09/2021-10 |
| October 2021: compatible without remediation | 99.6% | customer apps submitted to Microsoft's App Assure service by commercial customers, 2018 to 2021 · Worldwide · 2018-09/2021-10 |
| October 2021: applications that needed remediation | 3,307 | customer apps submitted to Microsoft's App Assure service by commercial customers, 2018 to 2021 · Worldwide · 2018-09/2021-10 |
| 2022: applications compatible with Windows 11, in Microsoft's own upgrade | 99.7% | apps in use at Microsoft, evaluated through App Assure · Worldwide · 2022 |
| 2022: Microsoft's qualifying devices upgraded within five weeks, with no rise in support tickets | 99% | 190,000 Microsoft employee devices deemed eligible for Windows 11 · Worldwide · 2021-10/2022 |
| March 2025: applications evaluated since 2018 | about 800,000 | apps evaluated by Microsoft's App Assure program · Worldwide · 2018-09/2025-03 |
| 2018 to 2025, Microsoft App Assure, enterprise applications: compatible with the next Windows | 99.7% | apps evaluated by Microsoft's App Assure program for enterprise customers · Worldwide · 2018-09/2025-03 |
| March 2025: minimum fleet for the free service, devices | 150+ devices | eligible Microsoft commercial customers · Worldwide · 2025-03 |
Sources: Kroll Ontrack; Symantec (2010); Cloudhouse (2022); Microsoft (2016-2025); Which?; IObit; Adaptiva (2016, 2017); Ivanti; Spiceworks (2015, 2019); Dell Technologies; Panasonic TOUGHBOOK (2025); HP; ControlUp (2024, 2025); Lansweeper; Nexthink (2022, 2025); Techaisle (2014, 2018); Laplink (2011, 2012); TechCentral.ie; Enterprise Systems Journal; Intel; Computer Weekly; ITPro; Microsoft and Intel
Server, database and website migrations: how many run late?
Industry studies of migration projects; none of these figures measures Zinstall's products.

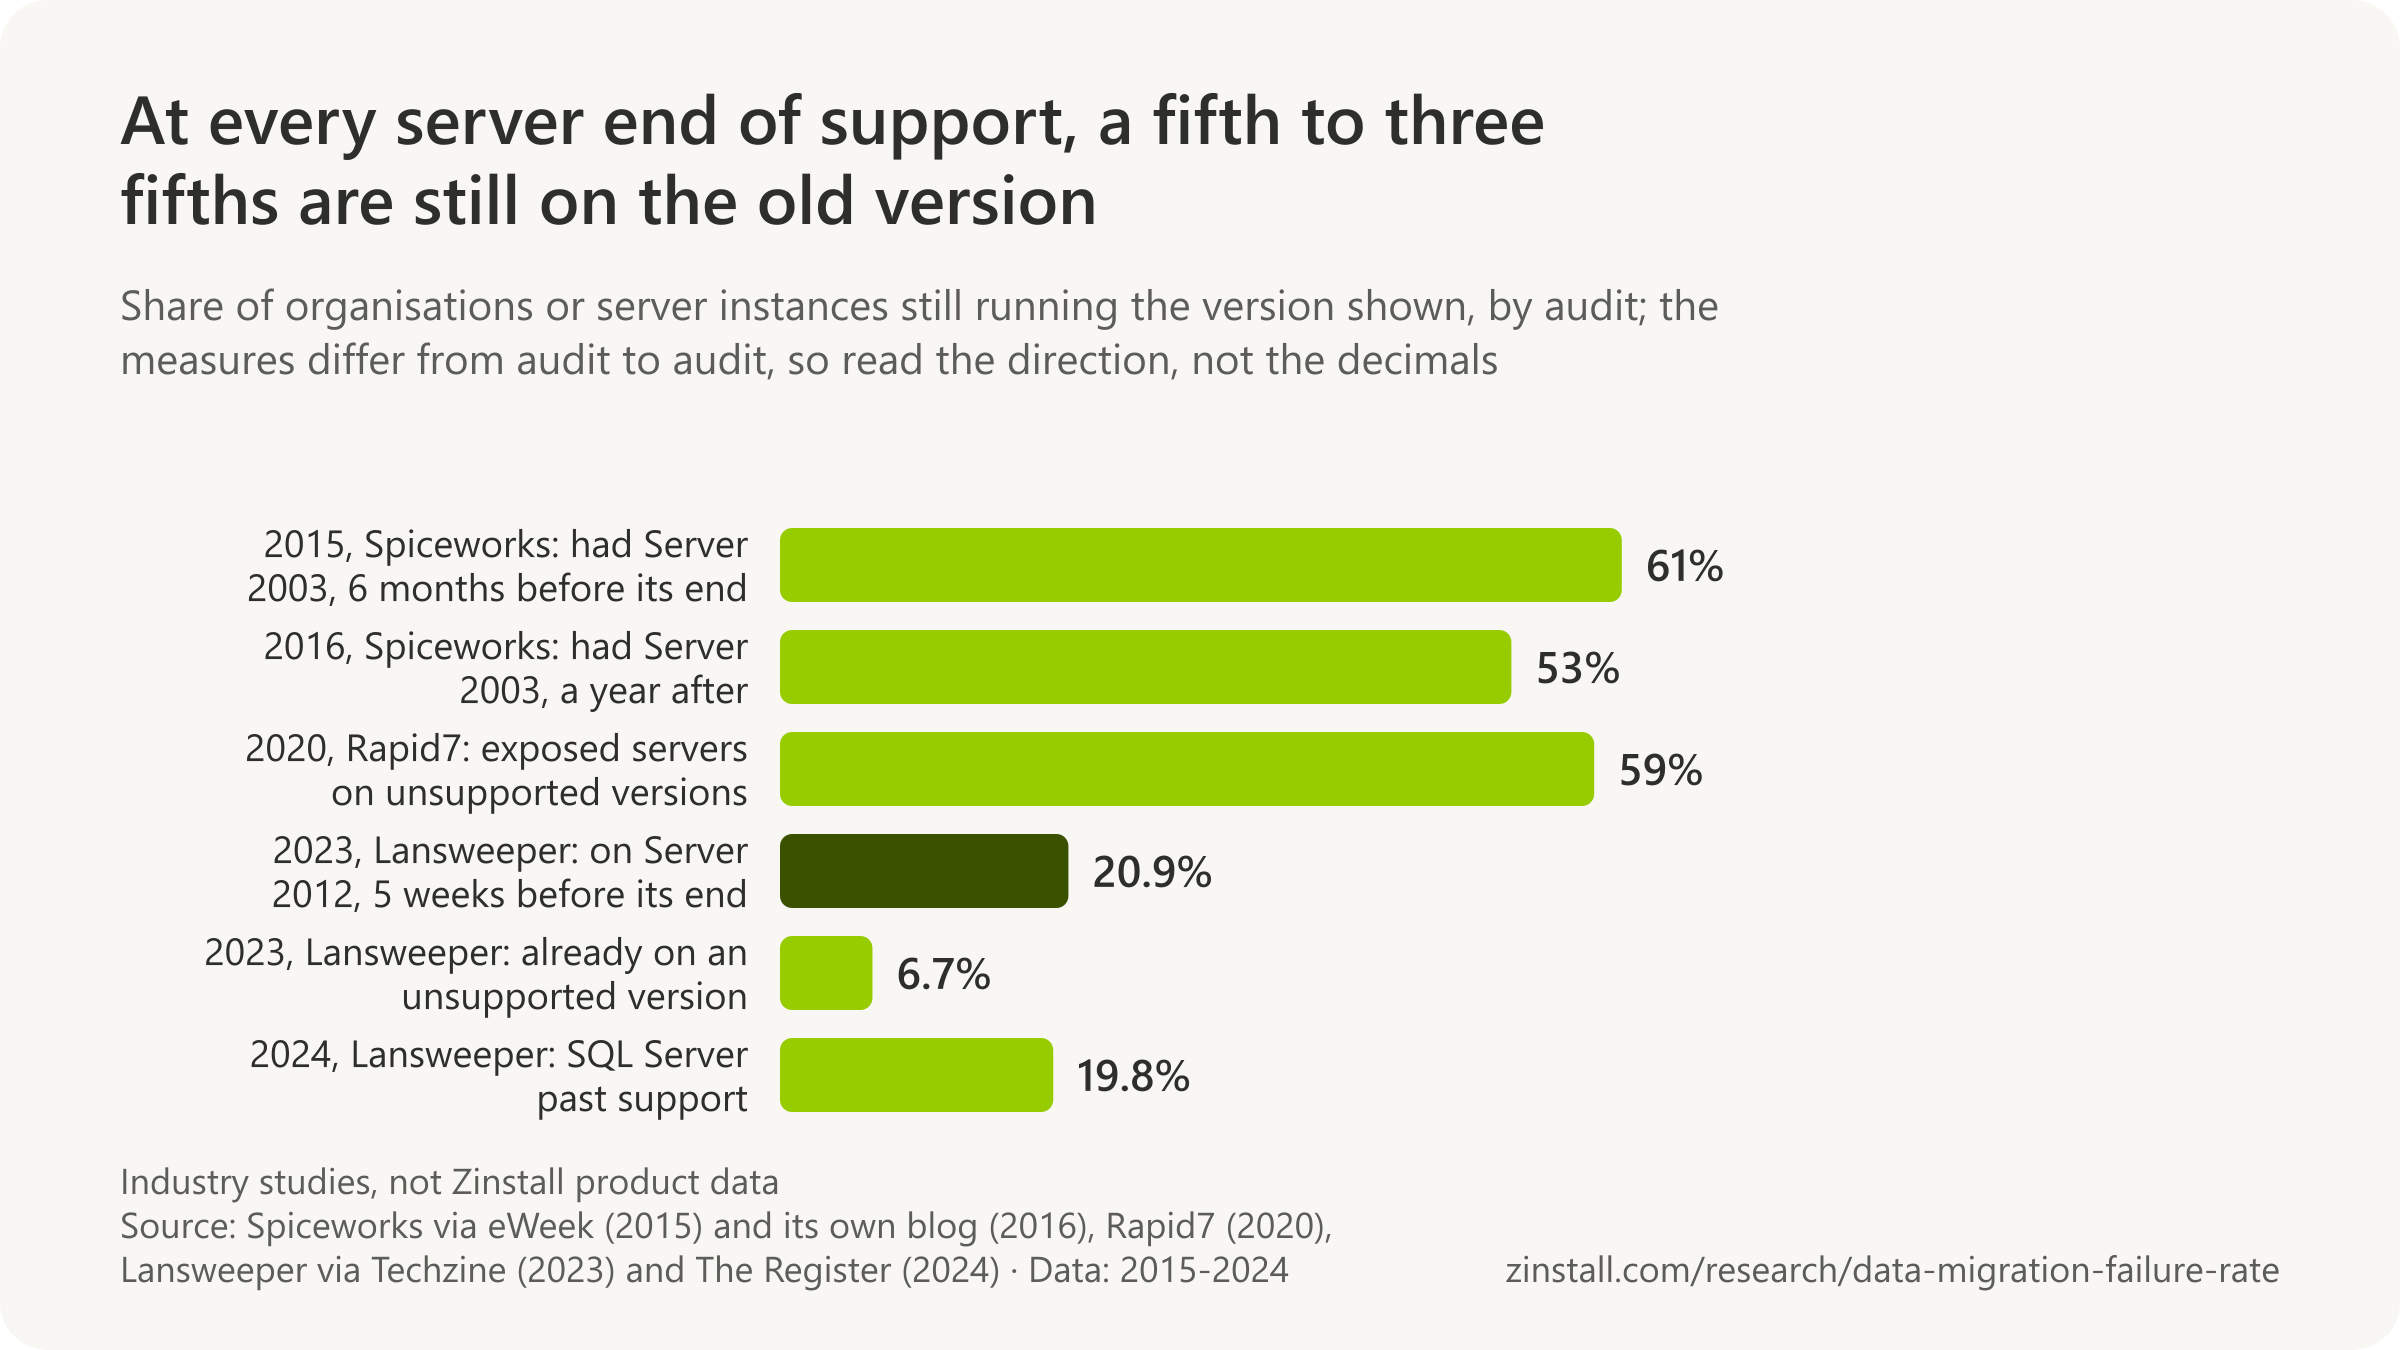
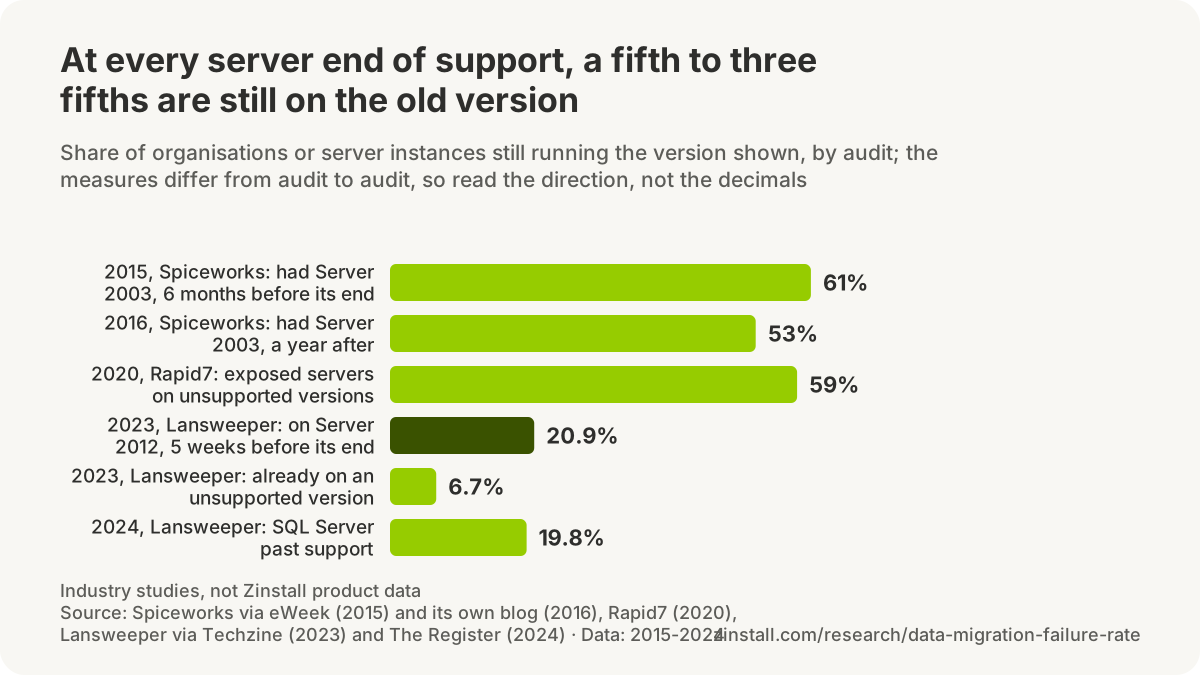
- Only 15% of companies had fully migrated off Windows Server 2003 by January 2015, six months before its end of support.
- In June 2016, 11 months after that deadline, 53% of organisations still ran at least one Server 2003 instance.
- 59% of internet-exposed Windows Server instances ran unsupported versions in September 2020.
- 69% of businesses had delayed switching web host because of migration worries, in a 2025 survey.
| Rule (Microsoft documentation, 2026) | Versions or years |
|---|---|
| In-place upgrade to Windows Server 2025: versions it can span | 4 versions |
| In-place upgrade to Windows Server 2022 and earlier: versions it can span | 2 versions |
| Cluster OS rolling upgrade: versions at a time | 1 version |
| Windows Server 2012: direct in-place upgrade to anything beyond 2016 | 0 of 3 |
| Minimum support life of a Long-Term Servicing Channel release before any ESU: years | 10 years |
| Extended Security Updates for Windows Server 2012 and 2012 R2: years, ending 13 October 2026 | 3 years |
| Windows Server 2012 and 2012 R2 ESU: yearly windows, each needing the prior year's licence | 3 windows |
| On-premises ESU price: share of the full licence price, each year | 100% per year |
| Windows Server 2008 R2: ESU years after January 2020, the fourth on Azure only | 4 years |
| Windows Server 2008 and 2008 R2: extra ESU year, Azure only | +1 year on Azure |
Sources: Techzine; Spiceworks (2016, 2015); Rapid7; W3Techs; Liquid Web; Microsoft (2026a, 2026b, 2025, 2022); The Register
More statistics (68)
61% of companies in the Spiceworks network had at least one instance of Windows Server 2003 running in January 2015, six months before its 14 July 2015 end of support (Spiceworks, 2015).
Nobody surveys server migrations the way Bloor surveyed data migrations, so the measure here is lateness: how much of the installed base is still on a version when Microsoft stops supporting it. Spiceworks asked its community before and after Windows Server 2003 died, Lansweeper counted the instances its customers ran five weeks before Windows Server 2012 did, and Rapid7 counted what was exposed to the internet. Microsoft's own documentation sets the mechanical limits on how far an in-place upgrade can jump, which is why so many of those late servers end up being migrated rather than upgraded. Databases and websites have only the counts their platforms choose to publish: Amazon's milestones for its migration service, and W3Techs' monthly census of which content systems sites switch between.
- 15% of respondents had fully migrated off Windows Server 2003 by January 2015, six months before its July 2015 end of support, in Spiceworks' survey of over 1,300 IT professionals who still ran it or had recently migrated (Spiceworks, 2015).
- $60,000 was the average budget companies allocated to Windows Server 2003 migration-related projects in Spiceworks' January 2015 survey of over 1,300 IT professionals, which Spiceworks scaled to a $100 billion opportunity (Spiceworks, 2015).
- 53% of companies in the Spiceworks network still had at least one instance of Windows Server 2003 running in June 2016, 11 months after its July 2015 end of support, down from 61% in January 2015 (Spiceworks, 2016).
- 20.9% of 1.3 million Windows Server instances inventoried by Lansweeper at more than 35,000 organisations were still running Windows Server 2012 or 2012 R2 five weeks before its 10 October 2023 end of support (Lansweeper data via Techzine, 2023).
- 1.3 million Windows Server instances at more than 35,000 organisations made up the Lansweeper inventory sample behind its September 2023 Windows Server 2012 end-of-support figures (Lansweeper data via Techzine, 2023).
- 19.8% of just over one million SQL Server instances scanned by Lansweeper were past Microsoft support in June 2024, three weeks before SQL Server 2014 left extended support on 9 July 2024 (Lansweeper data via The Register, 2024).
- 59% of all uniquely observed internet-exposed Windows Server instances were running unsupported versions in Rapid7's September 2020 Project Sonar scans, against 41% supported, eight months after Windows Server 2008 and 2008 R2 left support (Rapid7, 2020).
- 2,000,000+ internet-exposed Windows Server 2008 R2 instances disappeared from Rapid7's Project Sonar scans in the months after its January 2020 end of support, against about 40,000 for Windows Server 2008 (Rapid7, 2020).
- 4 versions is the furthest a non-clustered Windows Server can jump in one in-place upgrade to Windows Server 2025, which accepts direct upgrades from Windows Server 2012 R2 and later, per Microsoft's upgrade documentation updated April 2026 (Microsoft, 2026).
- 100% of the full Windows Server licence price per year was Microsoft's on-premises ESU price for Windows Server 2012 and 2012 R2 in each of the three ESU years, against no extra charge for servers moved to Azure (Microsoft, 2026).
- 3 years of paid Extended Security Updates were offered for Windows Server 2012 and 2012 R2 after their 10 October 2023 end of extended support, ending 13 October 2026 both in Azure (free) and outside it (Microsoft, 2025).
- 350,000+ databases had been migrated to AWS with the AWS Database Migration Service as of November 2020, ten times the 35,000 of September 2017 (Amazon Web Services, 2020).
- 33% (one-third) of database migrations in the AWS Database Migration Service preview also switched database engines, per AWS's general-availability announcement (Amazon Web Services, 2016).
- 7,500 (nearly) Oracle databases holding 75 petabytes were migrated by Amazon's own consumer business to AWS database services, a migration AWS reports cut database costs by over 60% (Amazon Web Services, 2020).
- 107,000+ databases were migrated to Azure with Microsoft's assistance between January and September 2018, per the Azure Database Migration Service team's Ignite 2018 update (Microsoft, 2018).
- 1,500 respondents to EDB's July 2020 Downloader Survey were asked their biggest obstacle when migrating Oracle databases to Postgres, the source EDB cites for its migration-obstacle chart (EDB, 2021).
- 3.2 percentage points is how far WordPress's share of all websites fell in W3Techs' survey between 1 October 2025 (43.3%) and 13 October 2026 (40.1%), while sites with no detected CMS rose from 28.6% to 31.6% (W3Techs, 2026).
- 0.69% of websites that were using WordPress until recently now use another content management system, per W3Techs' technology-changes survey of 13 October 2026, with Wix (0.06%), Squarespace (0.05%) and Joomla (0.01%) the largest destinations (W3Techs, 2026).
- 0.57% of websites currently using WordPress were using another content management system until recently, per W3Techs' technology-changes survey of 13 October 2026, with Wix (0.09%), Joomla (0.07%) and Squarespace (0.04%) the largest sources (W3Techs, 2026).
- 69% of businesses had delayed switching hosting provider because of migration concerns, most often when hosting WordPress, in Liquid Web's March 2025 survey of 506 business owners, developers and decision-makers (Liquid Web, 2025).
- 41% of businesses said they had regretted switching hosting provider at some point, in Liquid Web's March 2025 survey of 506 business owners, developers and decision-makers (Liquid Web, 2025).
- 506 business owners, developers and key decision-makers were surveyed by Liquid Web in March 2025 for its web hosting pain points study (Liquid Web, 2025).
- 20% (close to 1 in 5) of Duplicator's WordPress migration support tickets involved a PHP timeout or memory cap on the destination server stalling the site while it unpacked, the most common failure point in its analysis of 8,000+ support requests (Duplicator, 2026).
- 10% (nearly 1 in 10) of Duplicator's WordPress migration support tickets were site owners locked out of wp-admin after a migration that had otherwise succeeded, the second most common problem in its analysis of 8,000+ support requests (Duplicator, 2026).
- 67% (about 2 in 3) of Duplicator's WordPress migration and restore support tickets were resolved in under an hour, in its analysis of 8,000+ support requests (Duplicator, 2026).
- 1 year at least is how long Google says to keep redirects after a site move with URL changes, 'for as long as possible', per its Search Central documentation updated August 2026 (Google Search Central, 2026).
- 0 percentages for traffic loss appear in Google's site-move documentation; it says a medium-sized site can take a few weeks or more for Google to start showing new URLs instead of old ones, and larger sites longer (Google Search Central, 2026).
- 25 million users had been migrated by BitTitan, with customers in 188 countries, as of its July 2022 blog post on the Exertis distribution deal (BitTitan, 2022).
- 28 million+ users across 46,000+ organisations is BitTitan's cumulative migration count on its undated company history page as of October 2026, up from 25 million in 2021 and 2022 (BitTitan, 2026).
- 53% of companies were 'still running' Windows Server 2003 a year after its end of life, as Data Center Knowledge headlined Spiceworks' 2016 finding, dropping the qualifier 'at least one instance' (Data Center Knowledge, 2016).
- 15,000+ databases were migrated to Azure with Microsoft's assistance in August 2018 alone, per the Azure Database Migration Service team (Microsoft, 2018).
- 10% (one in 10) of businesses had never switched hosting provider, in Liquid Web's March 2025 survey of 506 business owners, developers and decision-makers (Liquid Web, 2025).
- 8,000+ support requests were analysed by Duplicator, of which about 4 in 10 were technical and just under a third of those were migrations, the largest technical category (Duplicator, 2026).
- 25 million+ users had been moved to the cloud by BitTitan for 46,000 customers in 188 countries since 2009, per the boilerplate of its October 2021 product release as carried by iTWire (BitTitan via iTWire, 2021).
| Audit, year and measure | Share | Scope |
|---|---|---|
| January 2015, Spiceworks, six months before Server 2003's end of support: companies with at least one instance | 61% | Companies in the Spiceworks network (the release does not say whether this share comes from network inventory data or from the 1,300+ survey respondents) · North America, EMEA and Asia Pacific · 2015-01 |
| 2015, Spiceworks: fully migrated off Server 2003 | 15% | Over 1,300 IT professionals in the Spiceworks network in North America, EMEA and APAC who had migrated a Windows Server 2003 server in the past year or still ran one, surveyed in January 2015 (study sponsored by SanDisk) · North America, EMEA and Asia Pacific · 2015-01 |
| 2015, Spiceworks: partially migrated | 48% | Over 1,300 IT professionals in the Spiceworks network in North America, EMEA and APAC who had migrated a Windows Server 2003 server in the past year or still ran one, surveyed in January 2015 (study sponsored by SanDisk) · North America, EMEA and Asia Pacific · 2015-01 |
| 2015, Spiceworks: still at the planning stage | 28% | Over 1,300 IT professionals in the Spiceworks network in North America, EMEA and APAC who had migrated a Windows Server 2003 server in the past year or still ran one, surveyed in January 2015 (study sponsored by SanDisk) · North America, EMEA and Asia Pacific · 2015-01 |
| 2015, Spiceworks: no plans to migrate | 8% | Over 1,300 IT professionals in the Spiceworks network in North America, EMEA and APAC who had migrated a Windows Server 2003 server in the past year or still ran one, surveyed in January 2015 (study sponsored by SanDisk) · North America, EMEA and Asia Pacific · 2015-01 |
| 2015, Spiceworks, those keeping Server 2003: citing software compatibility | 72% | Over 1,300 IT professionals in the Spiceworks network in North America, EMEA and APAC who had migrated a Windows Server 2003 server in the past year or still ran one, surveyed in January 2015 (study sponsored by SanDisk) · North America, EMEA and Asia Pacific · 2015-01 |
| 2016, Spiceworks, a year after: organisations with at least one Server 2003 instance | 53% | Physical servers and virtual machines, and the organisations running them, in Spiceworks' anonymised network inventory data, June 2016 (mostly on-premises, skewed to small and mid-sized businesses) · Worldwide (Spiceworks network, mostly on-premises) · 2016-06 |
| 2016, Spiceworks: Server 2003's share of server operating systems | 17.9% | Physical servers and virtual machines, and the organisations running them, in Spiceworks' anonymised network inventory data, June 2016 (mostly on-premises, skewed to small and mid-sized businesses) · Worldwide (Spiceworks network, mostly on-premises) · 2016-06 |
| 2016, Spiceworks: Server 2008's share, the most used | 45.4% | Physical servers and virtual machines, and the organisations running them, in Spiceworks' anonymised network inventory data, June 2016 (mostly on-premises, skewed to small and mid-sized businesses) · Worldwide (Spiceworks network, mostly on-premises) · 2016-06 |
| 2016, Spiceworks: Server 2012's share, four years after its release | 23.6% | Physical servers and virtual machines, and the organisations running them, in Spiceworks' anonymised network inventory data, June 2016 (mostly on-premises, skewed to small and mid-sized businesses) · Worldwide (Spiceworks network, mostly on-premises) · 2016-06 |
| 2020, Rapid7: internet-exposed Windows Server instances on an unsupported version | 59% | Windows Server instances exposed to the internet and fingerprinted by Rapid7's Project Sonar scans during September 2020 (internet-facing instances only) · Worldwide (internet-exposed servers) · 2020-09 |
| 2023, Lansweeper (via Techzine), 1.3 million instances five weeks before Server 2012's end of support: still on 2012 | 20.9% | 1.3 million Windows Server instances at more than 35,000 organisations inventoried by Lansweeper's IT asset-management software (vendor scan data, reported by Techzine with the chart caption 'Source: Lansweeper') · Worldwide (Lansweeper customer base) · 2023-09 |
| 2023, Lansweeper: already on an unsupported version | 6.7% | 1.3 million Windows Server instances at more than 35,000 organisations inventoried by Lansweeper's IT asset-management software (vendor scan data, reported by Techzine with the chart caption 'Source: Lansweeper') · Worldwide (Lansweeper customer base) · 2023-09 |
| 2024, Lansweeper (via The Register), over a million SQL Server instances: already unsupported | 19.8% | Just over one million SQL Server instances scanned by Lansweeper's agents in its customer base (vendor scan data, reported by The Register from an interview with Lansweeper's chief strategy officer Roel Decneut) · Worldwide (Lansweeper customer base) · 2024-06 |
| 2024, Lansweeper: unsupported after SQL Server 2014's end of support in July 2024 | 32% | Just over one million SQL Server instances scanned by Lansweeper's agents in its customer base (vendor scan data, reported by The Register from an interview with Lansweeper's chief strategy officer Roel Decneut) · Worldwide (Lansweeper customer base) · 2024-07 |
| 2024, Lansweeper: on SQL Server 2019 | 44% | Just over one million SQL Server instances scanned by Lansweeper's agents in its customer base (vendor scan data, reported by The Register from an interview with Lansweeper's chief strategy officer Roel Decneut) · Worldwide (Lansweeper customer base) · 2024-06 |
| 2024, Lansweeper: on SQL Server 2014, which left support in July 2024 | 12% | Just over one million SQL Server instances scanned by Lansweeper's agents in its customer base (vendor scan data, reported by The Register from an interview with Lansweeper's chief strategy officer Roel Decneut) · Worldwide (Lansweeper customer base) · 2024-06 |
| 2024, Lansweeper: still on SQL Server 2008, five years after its end of support | under 8% | Just over one million SQL Server instances scanned by Lansweeper's agents in its customer base (vendor scan data, reported by The Register from an interview with Lansweeper's chief strategy officer Roel Decneut) · Worldwide (Lansweeper customer base) · 2024-06 |
| Rule (Microsoft documentation, 2026) | Versions or years | Scope |
|---|---|---|
| In-place upgrade to Windows Server 2025: versions it can span | 4 versions | Microsoft's documented in-place upgrade paths for Windows Server (documentation, not a survey) · Worldwide · 2026-04 |
| In-place upgrade to Windows Server 2022 and earlier: versions it can span | 2 versions | Microsoft's documented in-place upgrade paths for Windows Server (documentation, not a survey) · Worldwide · 2026-04 |
| Cluster OS rolling upgrade: versions at a time | 1 version | Microsoft's documented in-place upgrade paths for Windows Server (documentation, not a survey) · Worldwide · 2026-04 |
| Windows Server 2012: direct in-place upgrade to anything beyond 2016 | 0 of 3 | Microsoft's documented in-place upgrade paths for Windows Server (documentation, not a survey) · Worldwide · 2026-04 |
| Minimum support life of a Long-Term Servicing Channel release before any ESU: years | 10 years | Microsoft's Windows Server lifecycle policy (documentation) · Worldwide · 2025 |
| Extended Security Updates for Windows Server 2012 and 2012 R2: years, ending 13 October 2026 | 3 years | Microsoft's Extended Security Update terms for Windows Server 2012 and 2012 R2 (documentation) · Worldwide · 2023-10-10 to 2026-10-13 |
| Windows Server 2012 and 2012 R2 ESU: yearly windows, each needing the prior year's licence | 3 windows | Microsoft's ESU availability table (documentation) · Worldwide · 2023-10-10 to 2026-10-13 |
| On-premises ESU price: share of the full licence price, each year | 100% per year | Microsoft's Extended Security Update terms for Windows Server 2012 and 2012 R2 (documentation) · Worldwide · 2023-10 to 2026-10 |
| Windows Server 2008 R2: ESU years after January 2020, the fourth on Azure only | 4 years | Windows Server 2008 R2 with Extended Security Updates · Worldwide · 2020-01-14 to 2024-01-09 |
| Windows Server 2008 and 2008 R2: extra ESU year, Azure only | +1 year on Azure | Microsoft's ESU terms for Windows Server 2008 and 2008 R2 (documentation) · Worldwide · 2023-01 to 2024-01 |

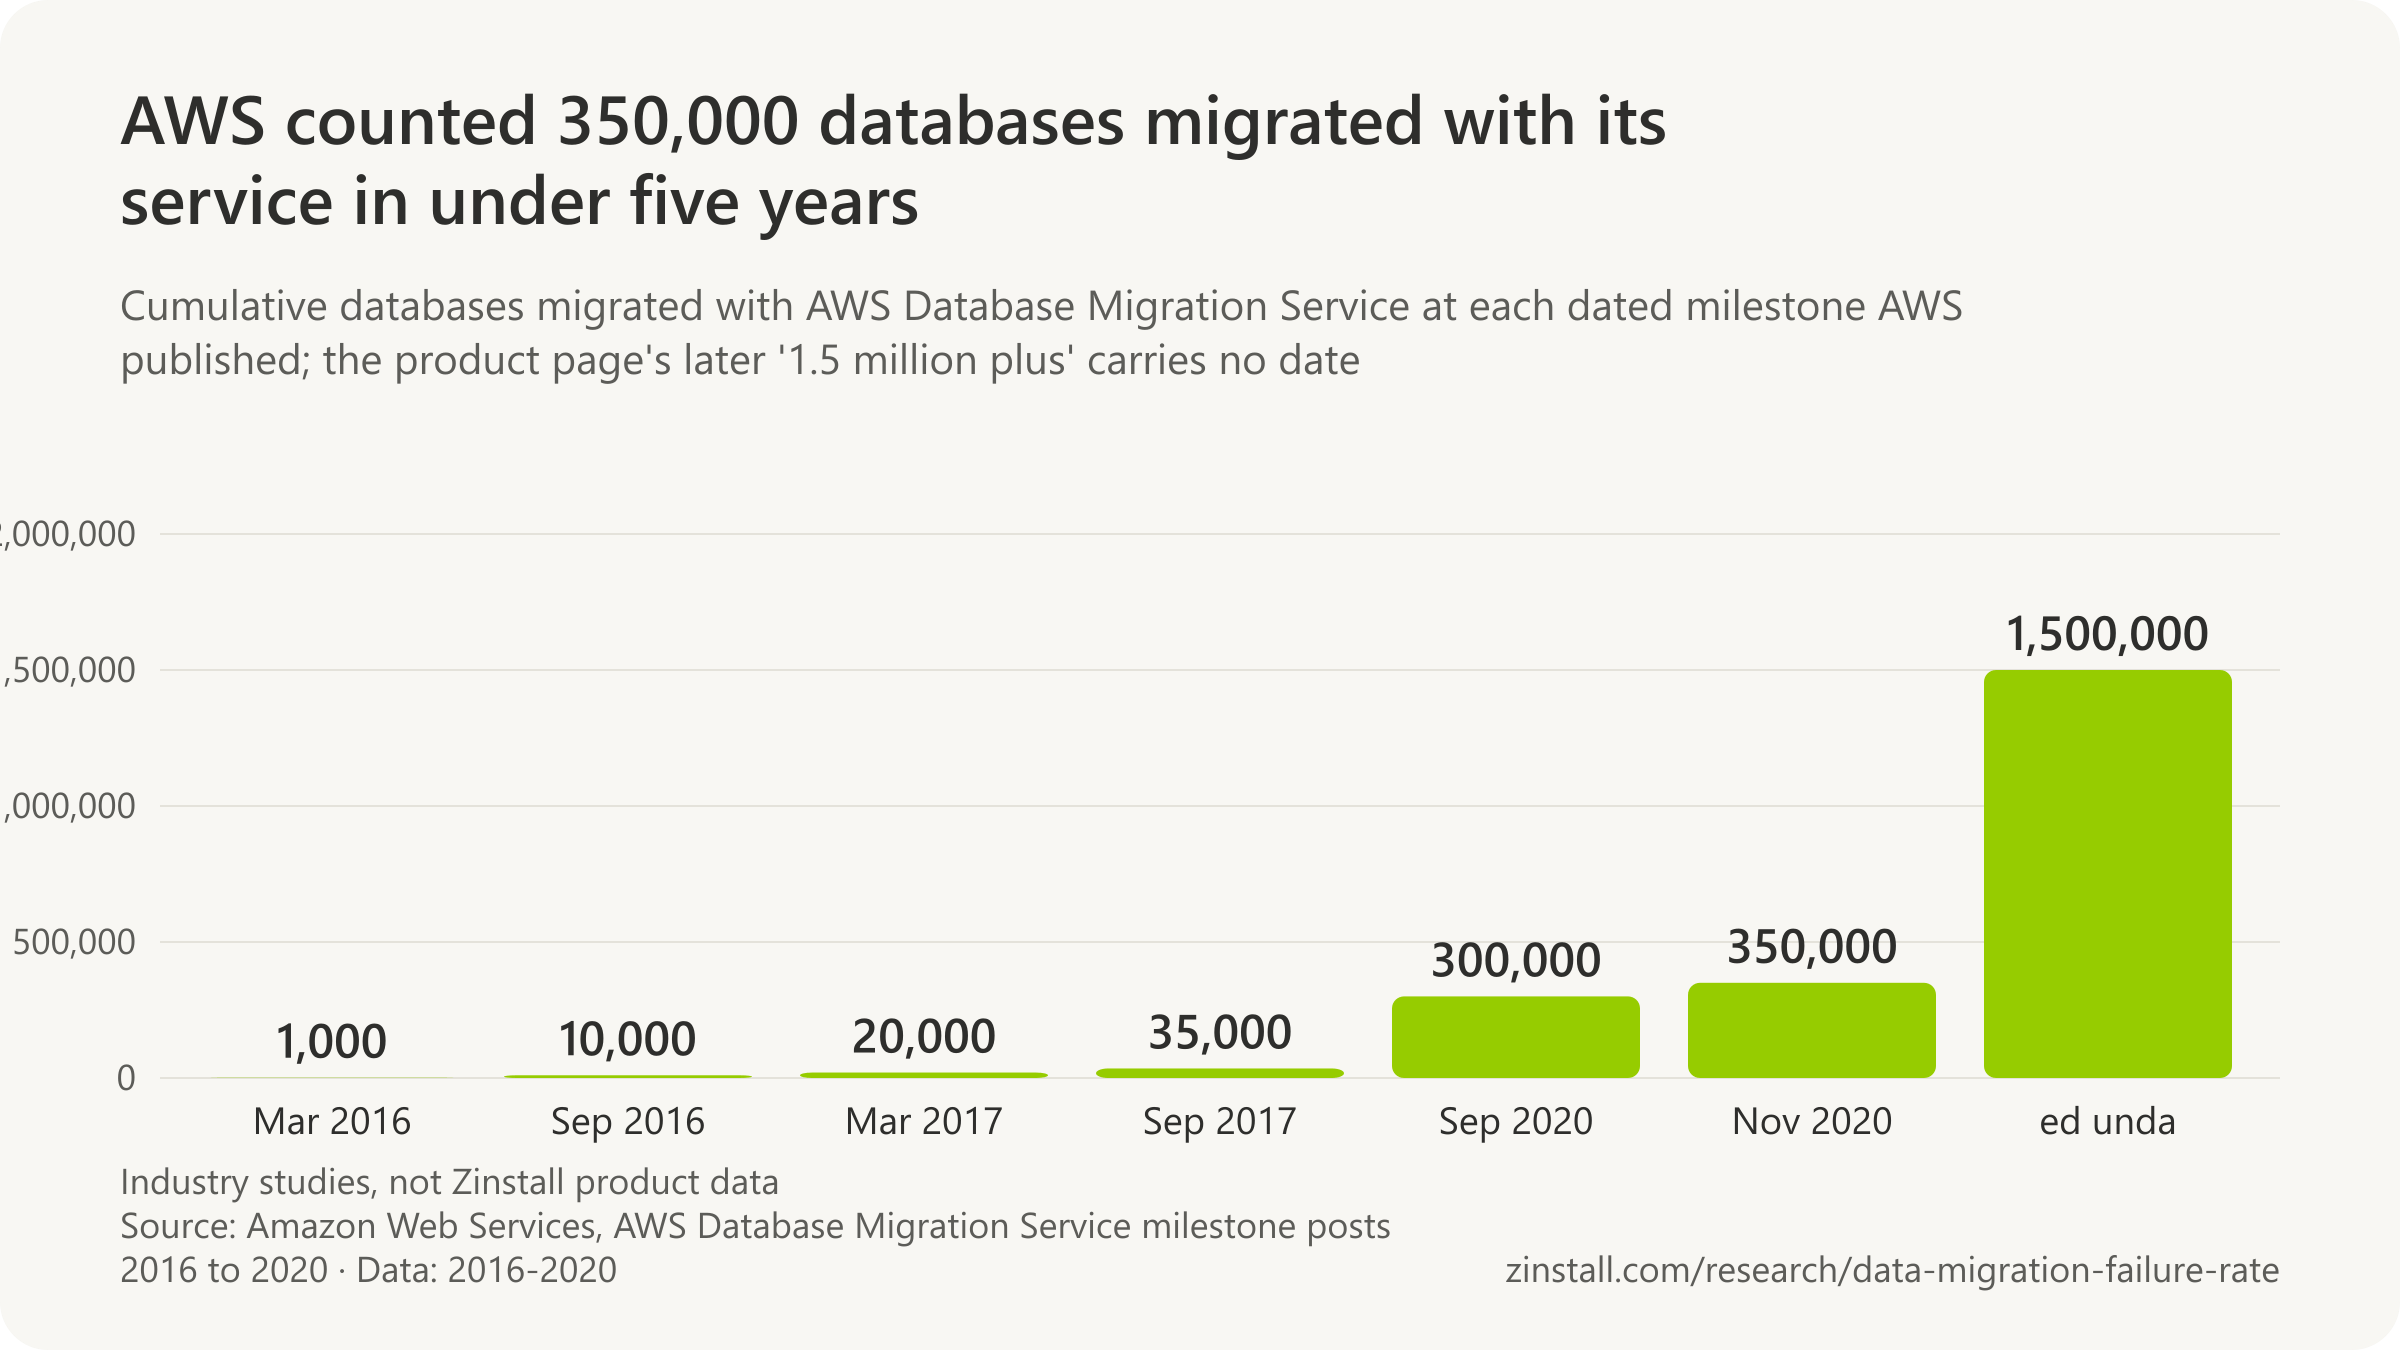
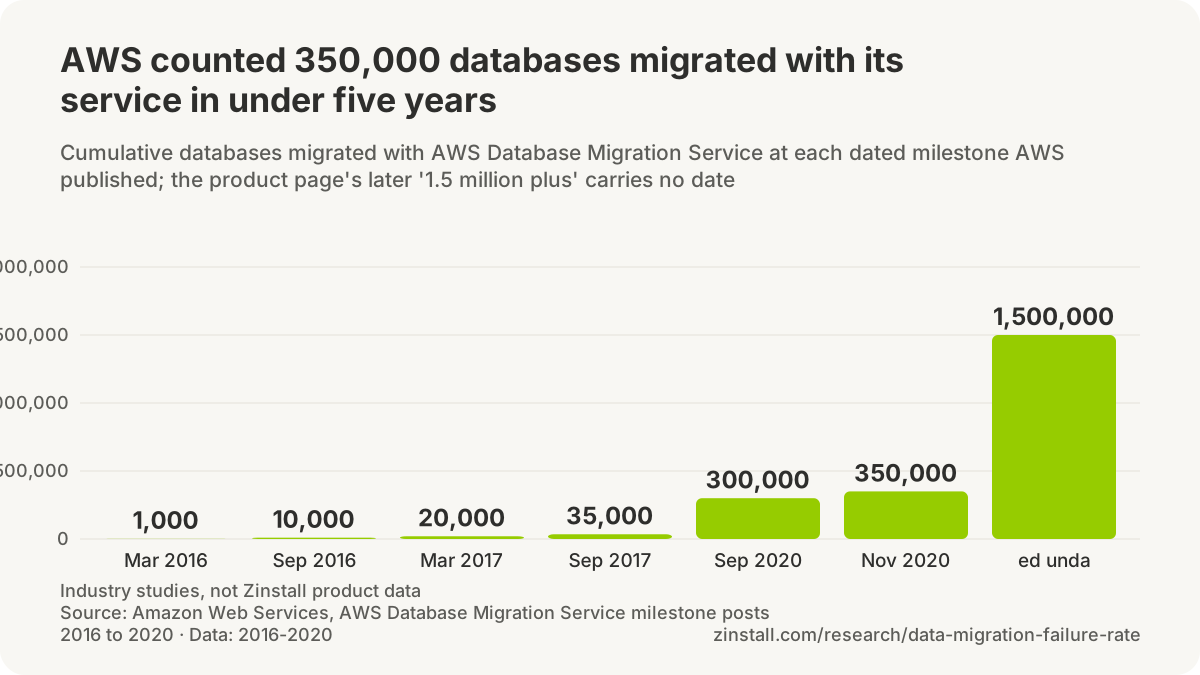

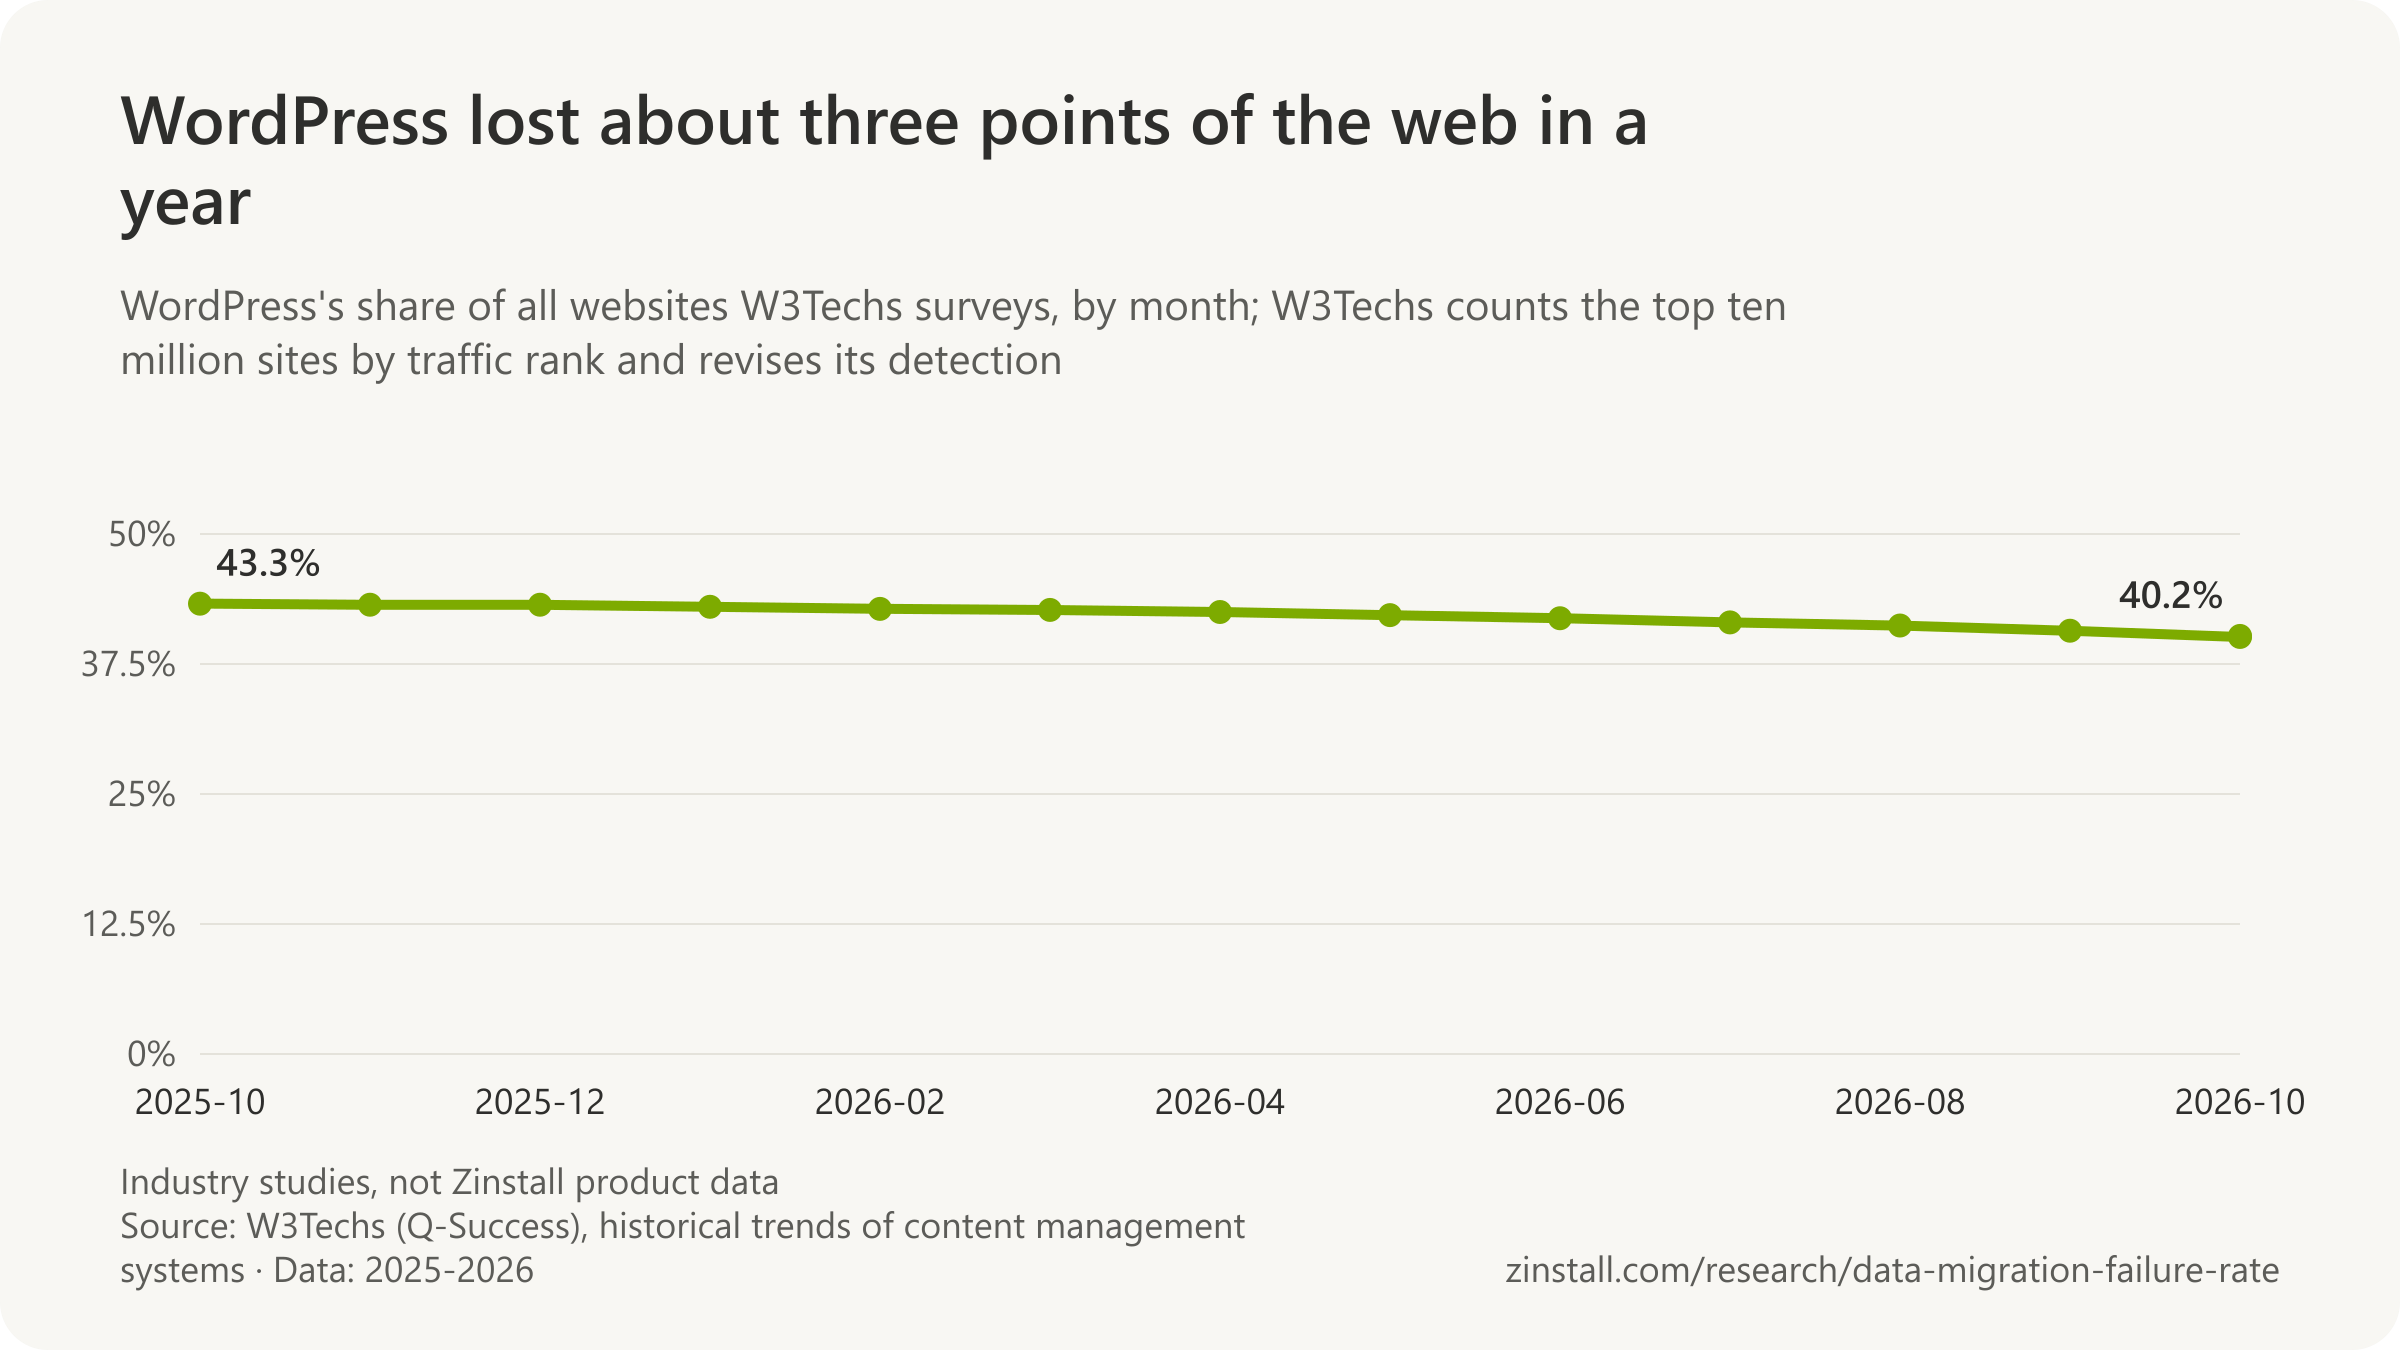
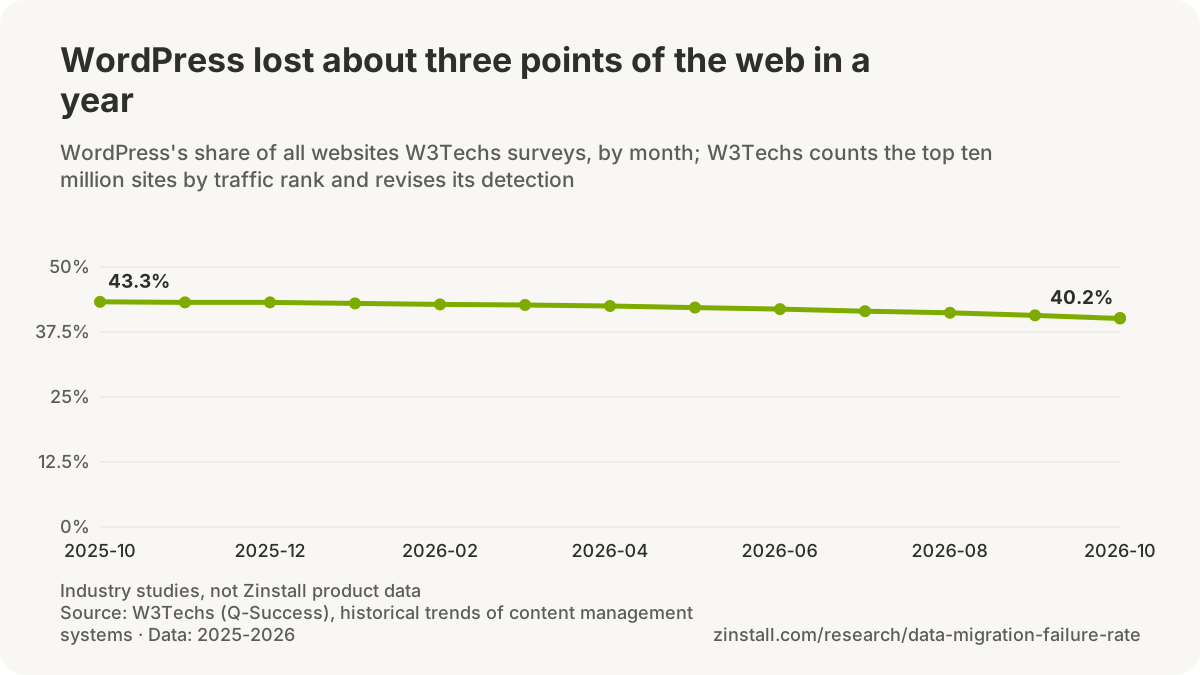
| Pair of systems and direction | Share of sites | Scope |
|---|---|---|
| Sites on WordPress that recently used another CMS | 0.57% | Websites using WordPress among the top 10 million surveyed by W3Techs (technology changes report) · Worldwide · 2026-10-13 |
| Sites that recently used WordPress and now use another CMS | 0.69% | Websites that were using WordPress until recently among the top 10 million surveyed by W3Techs (technology changes report) · Worldwide · 2026-10-13 |
| Sites on WordPress that recently used Wix, the largest single inbound source | 0.09% | Websites using WordPress among the top 10 million surveyed by W3Techs · Worldwide · 2026-10-13 |
| Sites that recently used WordPress and now use Wix, the largest single destination | 0.06% | Websites that were using WordPress until recently among the top 10 million surveyed by W3Techs · Worldwide · 2026-10-13 |
| Sites on Shopify that recently used WordPress | 1.04% | Websites using Shopify among the top 10 million surveyed by W3Techs (technology changes report) · Worldwide · 2026-10-13 |
| Sites that recently used Shopify and now use WordPress | 0.23% | Websites that were using Shopify until recently among the top 10 million surveyed by W3Techs (technology changes report) · Worldwide · 2026-10-13 |
| Sites on Wix that recently used WordPress | 0.56% | Websites using Wix among the top 10 million surveyed by W3Techs (technology changes report) · Worldwide · 2026-10-13 |
| Sites that recently used Wix and now use WordPress | 0.85% | Websites that were using Wix until recently among the top 10 million surveyed by W3Techs (technology changes report) · Worldwide · 2026-10-13 |
| Sites on Squarespace that recently used WordPress | 0.78% | Websites using Squarespace among the top 10 million surveyed by W3Techs (technology changes report) · Worldwide · 2026-10-13 |
| Sites that recently used Squarespace and now use WordPress | 0.65% | Websites that were using Squarespace until recently among the top 10 million surveyed by W3Techs (technology changes report) · Worldwide · 2026-10-13 |
| Sites on Joomla that recently used WordPress | 0.31% | Websites using Joomla among the top 10 million surveyed by W3Techs (technology changes report) · Worldwide · 2026-10-13 |
| Sites that recently used Joomla and now use WordPress | 2.61% | Websites that were using Joomla until recently among the top 10 million surveyed by W3Techs (technology changes report) · Worldwide · 2026-10-13 |
| Sites on Drupal that recently used WordPress | 0.95% | Websites using Drupal among the top 10 million surveyed by W3Techs (technology changes report) · Worldwide · 2026-10-13 |
| Sites that recently used Drupal and now use WordPress | 2.35% | Websites that were using Drupal until recently among the top 10 million surveyed by W3Techs (technology changes report) · Worldwide · 2026-10-13 |
Sources: Spiceworks (2015, 2016); Techzine; The Register; Rapid7; Microsoft (2018-2026); Amazon Web Services (2016-2026); EnterpriseDB; W3Techs (2026); Liquid Web; Duplicator; Google; BitTitan (2022, 2026); Data Center Knowledge; iTWire
How much does a PC migration cost, and how long does it take?
Industry studies of migration projects; none of these figures measures Zinstall's products.
Deploying one PC with an organisation's own process cost $615 on average, including IT labour, logistics and lost user time, in vendor-sponsored research (IDC, 2012).

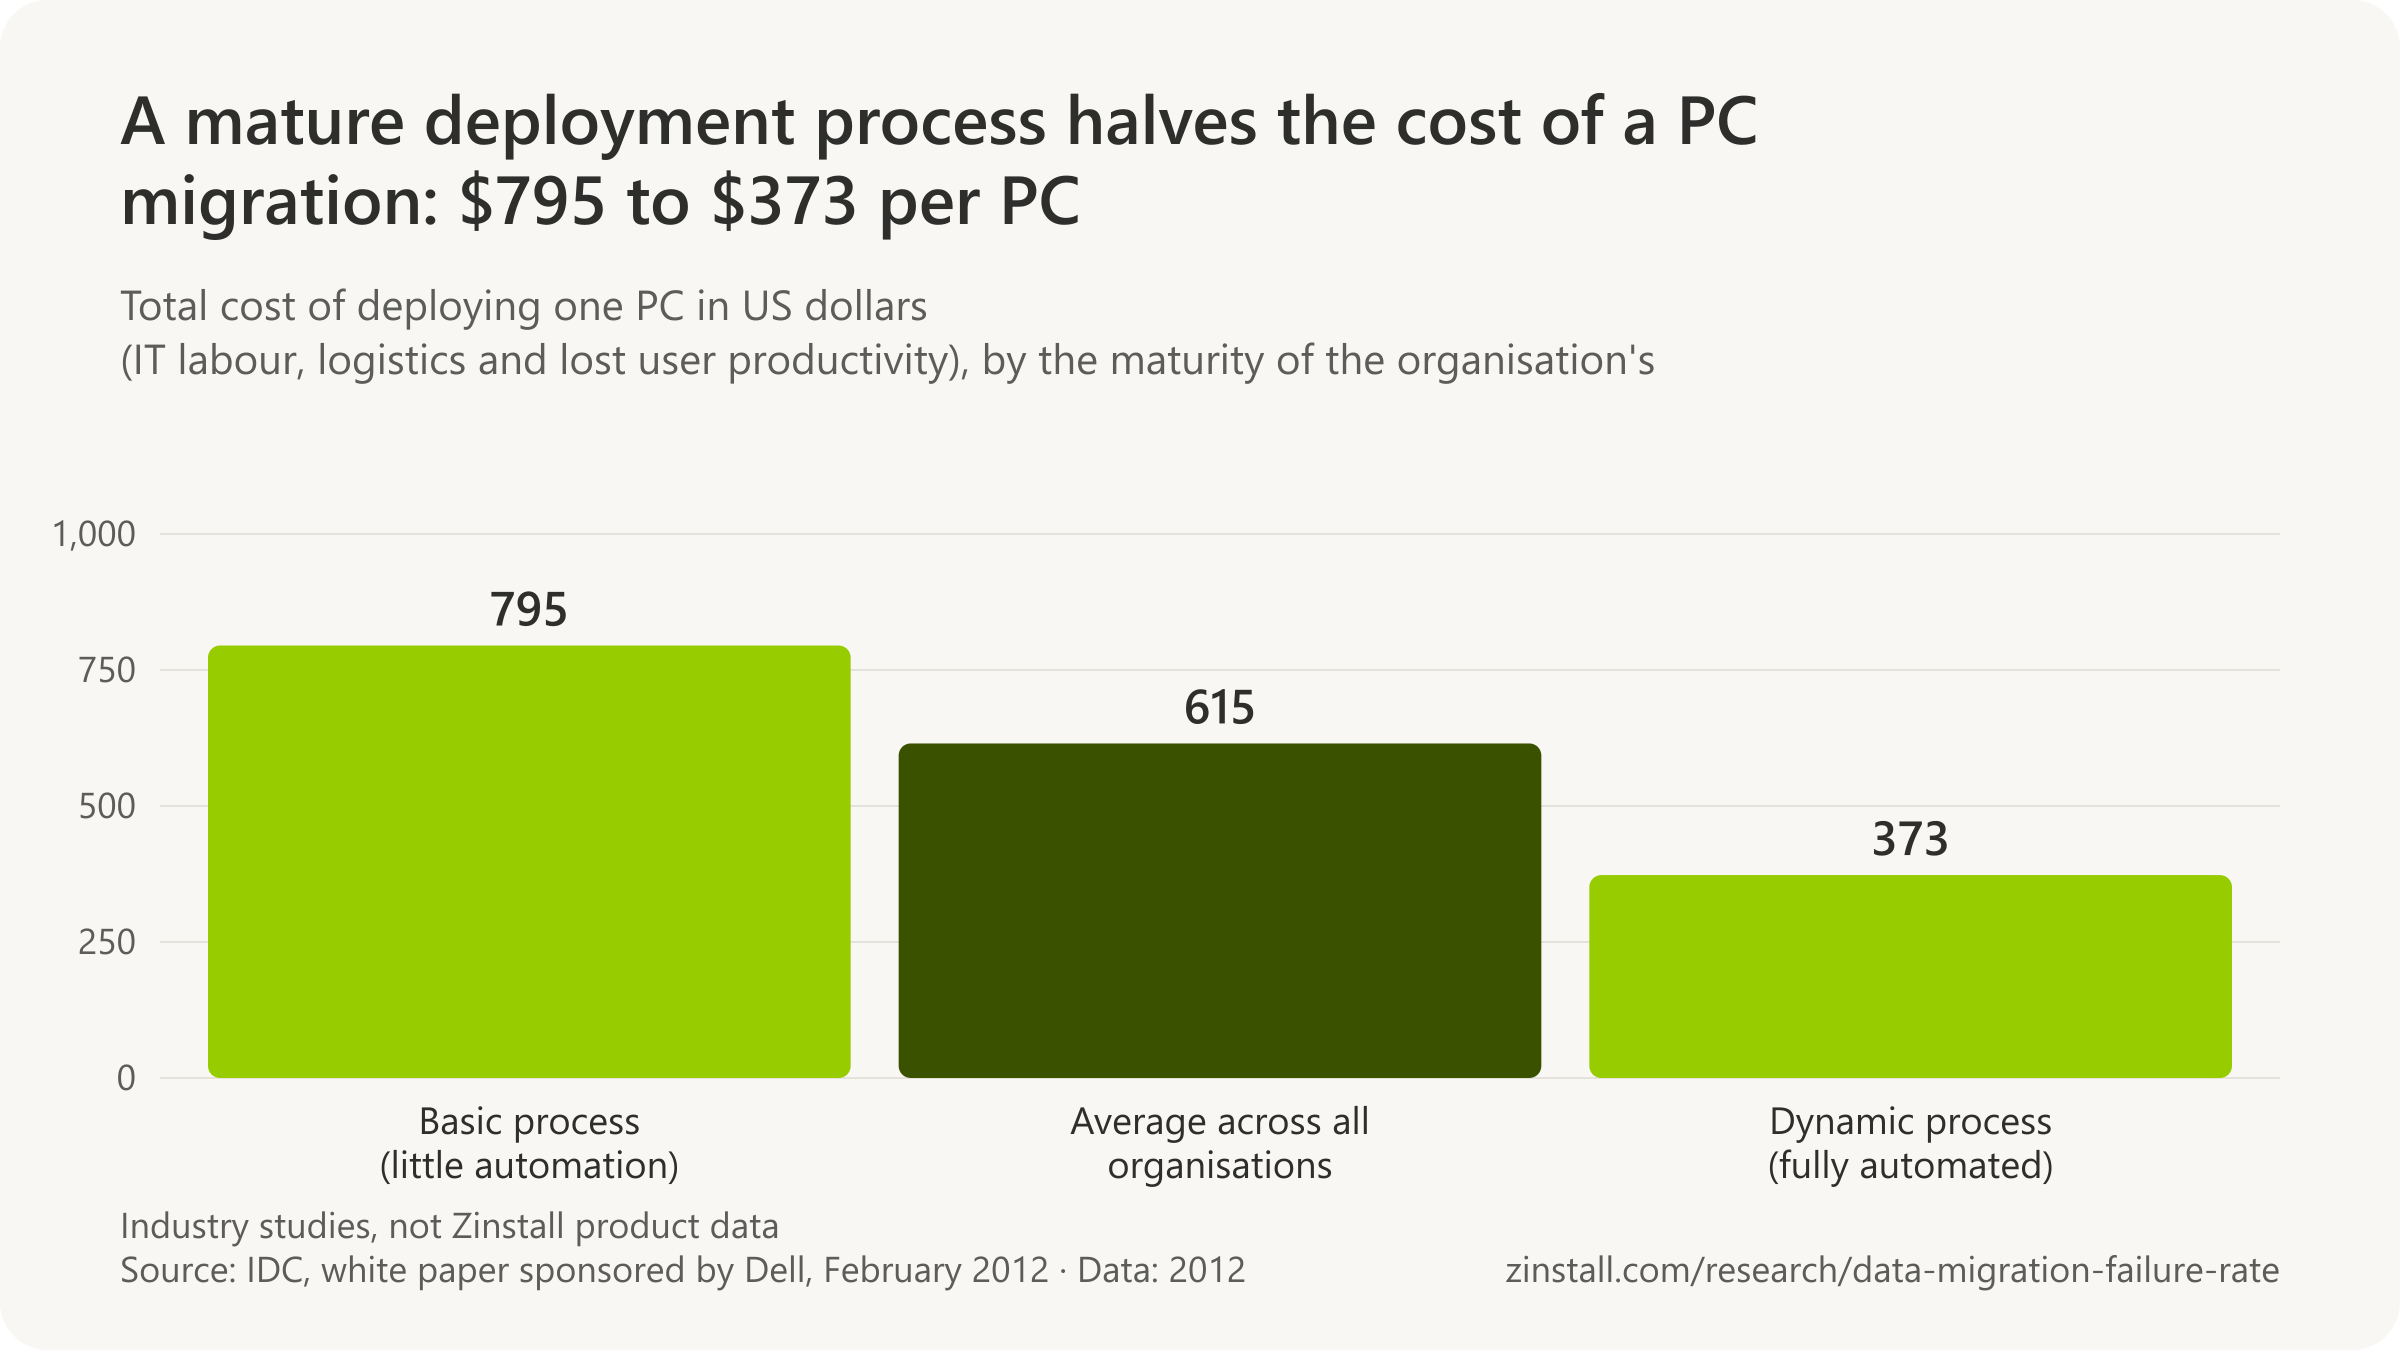
- IT staff spent 1.66 hours deploying each new PC, on average.
- Top-tier IT teams put 20 hours of preparation into a Windows 7 migration, against nine at the bottom tier.
- 90% or more of mid-size and large enterprises put an hour of downtime above $300,000, by their own estimate, in 2024.
- 1 in 5 data-centre operators said their most recent major outage cost over $1 million, in 2025, on a small survey base.
- A Windows 10 PC four or more years old cost $1,525 a year to own, 3.3 times a newer one, in a 2020 small-business study.
| Measure (IDC white paper for Dell, February 2012) | US dollars |
|---|---|
| Costs 'not uncommon' at the high end | over $700 |
| Basic maturity: total cost per PC | $795 per PC |
| Dynamic maturity: total cost per PC | $373 per PC |
| Saving per PC from a mature process | $337 (55%) per PC |
| Worldwide average per PC in the paper's table (of which IT labour $436) | $578 per PC |
| Lost user productivity per PC deployed | $51 per PC |
Sources: IDC; Symantec; ITIC; Uptime Institute; Techaisle
More statistics (114)
$615 per PC was the average cost of deploying a PC (IT labour, logistics and lost user productivity) in IDC's 2012 research for a Dell-sponsored white paper (IDC, 2012).
The per-PC cost figure that migration vendors have quoted for over a decade turns out to have a real document behind it: an IDC white paper written for Dell in early 2012, which costed the whole deployment of a new PC, IT labour first, and found that organisations with a mature, automated process spent less than half what the least mature did. The time measurements are older or narrower still: Symantec's survey of Windows 7 upgrades, IDC's deployment hours and a laboratory test of four transfer tools on one laptop model. At the project level Bloor measured what its success factors saved, and at the other end of the scale the downtime surveys put a price on every hour a migration takes longer than planned, though they are estimates by the people surveyed, not audited losses. Zinstall's own transfer timings are not used on this page.
- 1.66 hours was the average IT time to deploy a new PC across all maturity levels in IDC's 2012 Dell-sponsored white paper (IDC, 2012).
- 55% (up to $337 per PC) was the IT labour cost reduction available to organisations that moved from Basic to Dynamic PC deployment practices in IDC's 2012 Dell-sponsored white paper (IDC, 2012).
- $795 per PC was the total deployment cost at organisations with Basic (little automation) PC deployment practices, falling to $583 at Standardized, $523 at Rationalized and $373 at Dynamic, in IDC's 2012 Dell-sponsored white paper (IDC, 2012).
- $373 per PC was the total deployment cost at organisations with Dynamic (fully automated) PC deployment practices in IDC's 2012 Dell-sponsored white paper (IDC, 2012).
- $300 to $500 per migrated PC is the labour cost of a PC refresh according to Laplink's customer feedback, in the 2025 Intel and Laplink solution brief (Intel and Laplink, 2025).
- $50 to $80 per call is what help desk calls can cost after manual PC migrations, according to Laplink's customer feedback in the 2025 Intel and Laplink solution brief (Intel and Laplink, 2025).
- $250 per computer was Gartner Group's estimated average saving from implementing a migration solution in a corporate environment, as quoted in Intel's 2002 PC Migration Work Group announcement (Gartner via Intel, 2002).
- 50 minutes was the time for Dell Migrate to move 100 GB of files and settings from a Dell Latitude 5491 to a Dell XPS 13 9300 over Wi-Fi, in Principled Technologies' 2020 test commissioned by Dell (Principled Technologies, 2020).
- 2 hours 55 minutes was the time for Laplink PCmover Professional to move the same 100 GB from a Dell Latitude 5491 to a Dell XPS 13 9300, the slowest of four tools in Principled Technologies' 2020 test for Dell (Principled Technologies, 2020).
- 5 hours was the average time to migrate each existing machine from an old operating system to Windows 7, falling to 4 hours for a fresh install on a new machine, among 1,360 IT managers surveyed for Symantec in 2010 (Symantec survey via TechCentral.ie, 2010).
- US$1,525 per year was the total cost of owning and maintaining a Windows 10 PC four or more years old, 3.3 times that of a newer Windows 10 PC, among 2,085 SMBs surveyed by Techaisle for Microsoft in 2020 (Techaisle, 2020).
- 70 hours of productive time per PC per year were lost on Windows 10 PCs four or more years old, among 2,085 SMBs surveyed by Techaisle for Microsoft in 2020 (Techaisle, 2020).
- US$2,736 per device was the cost of keeping a PC more than four years old, enough to buy two or more new PCs, among 2,156 Asia Pacific SMBs surveyed by Techaisle for Microsoft and Intel in 2018 (Microsoft, 2018).
- $427 was the average spend to repair a PC four years or older, 1.3 times the repair cost of a newer PC, among 736 small businesses surveyed for Intel by Techaisle in 2013 (Intel, 2013).
- $170,000 per project was the average cost saving from implementing all six quantified success factors together, according to Bloor Research's 2011 data migration survey (Bloor Research, 2011).
- $5 billion was Bloor Research's estimate of annual spend on data migration in 2007 for the Global 2000 projects it surveyed, described as a lower bound (Bloor Research, 2007).
- $8 billion worldwide by 2012 was Bloor Research's conservative forecast for the data migration market in its 2007 survey, restated unchanged in its 2011 report (Bloor Research, 2011).
- More than 30% of respondents needed additional hardware exclusively for data migration, at a median cost of $225,000, in the Information Architecture Team's 2002 survey (IAT via KDnuggets, 2002).
- $60,000 was the average budget companies allocated to Windows Server 2003 migration-related projects in Spiceworks' January 2015 survey of over 1,300 IT professionals, which Spiceworks scaled to a $100 billion opportunity (Spiceworks, 2015).
- 41% of enterprises said hourly downtime costs their firm $1 million to over $5 million in ITIC's 2024 Hourly Cost of Downtime Survey of over 1,000 firms, up from 11% of large enterprises in its 2013 survey (ITIC, 2024).
- 90%+ of mid-size and large enterprises put the average cost of a single hour of downtime above $300,000, excluding litigation and penalties, in ITIC's 2024 Hourly Cost of Downtime Survey of over 1,000 firms polled from November 2023 to mid-March 2024 (ITIC, 2024).
- 0 measured losses sit behind ITIC's hourly cost of downtime shares: the report states they are respondents' estimates of one hour of downtime from interrupted transactions, lost or damaged data and productivity (ITIC, 2024).
- 57% of respondents to Uptime Institute's 2025 annual survey said their most recent major outage cost more than $100,000, up from 54% in the 2024 and 2023 surveys (Uptime Institute, 2026).
- 20% (one in five) of respondents to Uptime Institute's 2025 annual survey said their most recent impactful outage cost more than $1 million, for the second year in a row (Uptime Institute, 2026).
- 94 respondents answered the outage-cost question in Uptime Institute's 2025 survey (91 in 2024), the base behind its 57% and one-in-five headline shares (Uptime Institute, 2026).
- $8,851 was the average total cost per minute of an unplanned data-centre outage at 63 US data centres in the Ponemon Institute's 2016 study for Emerson Network Power, up from $5,617 in 2010 and $7,908 in 2013 (Ponemon/Emerson, 2016).
- $740,357 was the average total cost of an unplanned data-centre outage at the 63 US data centres in the Ponemon Institute's 2016 Cost of Data Center Outages study for Emerson Network Power, up 38% from $505,502 in its 2010 study (Ponemon/Emerson, 2016).
- $5,600 per minute has been repeated as Gartner's average cost of IT downtime since 2014 'like an old family legend', Enterprise Management Associates wrote in a 2022 e-book that calls the figure largely unchallenged (EMA, 2022).
- 97% of large enterprises with more than 1,000 employees said one hour of downtime costs over $100,000 in ITIC's 2024 Hourly Cost of Downtime Survey, its 11th, of over 1,000 firms (ITIC, 2024).
- 32% is how much ITIC says hourly downtime costs rose in the seven years to 2021 across its surveys (ITIC via TechChannel, 2021).
- $1,667 per minute per server is ITIC's arithmetic for a company that puts one hour of mission-critical downtime at $100,000, rising to $16,670 per minute when ten servers are down (ITIC, 2020).
- 76% of corporations cited security and data breaches as the top cause of server, operating system, application and network downtime in ITIC's 2022 Global Server Hardware Security survey of 1,300 businesses, up from 22% in 2012 (ITIC, 2022).
- 80% (four in five) of respondents to the 2023 Uptime Institute data-centre survey said their most recent serious outage could have been prevented with better management, processes and configuration (Uptime Institute, 2024).
- 10% (around one in ten) of respondents to Uptime Institute's 2025 annual survey said their last outage had serious or severe impacts (Uptime Institute, 2026).
- $5,600 per minute is 'the average cost of downtime, according to a 2014 study by Gartner', as Atlassian's incident-management guide restates the figure while noting Gartner calls it only an average (Atlassian, undated page, 2026).
- $9,000 per minute (nearly) is how Atlassian restates Ponemon's 2016 data-centre outage figure, framing it as a later report that 'raises Gartner's average' of $5,600, although the two measure different things (Atlassian, undated page, 2026).
- $336,000 per hour is how Dotcom-Monitor's 2026 downtime-cost post restates Gartner's 2014 figure of $5,600 per minute, calling it a 'widely cited baseline' still current in 2026 (Dotcom-Monitor, 2026).
- 98% of large enterprises report at least $100,000 per hour of downtime, Dotcom-Monitor's 2026 post says citing ITIC's 2024 survey, whose own report gives 97% (Dotcom-Monitor, 2026).
| Measurement, year and method | Time | Scope |
|---|---|---|
| 2010, Symantec survey: hours to migrate one existing machine to Windows 7 (four for a fresh install) | 5 hours per PC | 1,360 respondents worldwide at businesses that had completed a Windows 7 migration (phone survey by Applied Research for Symantec, August 2010; median employer size 1,000 to 2,499 employees) · Worldwide (Irish outlet) · 2010-08 |
| 2010, Symantec survey: IT preparation hours per Windows 7 upgrade | 10 hours | More than 1,300 IT managers worldwide at businesses that had completed a Windows 7 migration (phone survey by Applied Research for Symantec, August 2010) · Worldwide · 2010-08 |
| 2012, IDC for Dell: IT hours to deploy one new PC, average | 1.66 hours per PC | organisations deploying PCs, studied by IDC for a Dell-sponsored white paper (sample size not stated in the paper) · Worldwide · 2012 |
| 2012, IDC for Dell: IT hours at the least mature organisations (0.7 at the most mature) | 2.9 hours vs 0.7 | organisations deploying PCs, studied by IDC for a Dell-sponsored white paper (sample size not stated in the paper) · Worldwide · 2012 |
| 2017, Adaptiva survey: share expecting two to four hours per PC (Windows 10) | 57%: 2 to 4 hours per PC | 446 respondents (about 47% IT system administrators and technical support staff, about 60% managing more than 1,000 systems) drawn from Adaptiva's customer base, May 2017 · United States (mainly) · 2017-05 |
| 2020, Principled Technologies for Dell: minutes to move 100 GB with Dell Migrate | 50 minutes | hands-on lab test of four migration tools moving a standardised 100 GB data set from three older laptops to new Dell XPS 13 9300 and Lenovo ThinkPad L14 laptops over Wi-Fi (testing concluded 21 July 2020) · United States (lab) · 2020-07 |
| 2020, Principled Technologies: minutes with EaseUS (Lenovo's tool took 126) | 1 h 45 min / 2 h 06 min | hands-on lab test of four migration tools moving a standardised 100 GB data set from three older laptops to new Dell XPS 13 9300 and Lenovo ThinkPad L14 laptops over Wi-Fi (testing concluded 21 July 2020) · United States (lab) · 2020-07 |
| 2020, Principled Technologies: minutes with Laplink PCmover | 2 h 55 min | hands-on lab test of four migration tools moving a standardised 100 GB data set from three older laptops to new Dell XPS 13 9300 and Lenovo ThinkPad L14 laptops over Wi-Fi (testing concluded 21 July 2020) · United States (lab) · 2020-07 |
| 2020, Principled Technologies: slowest run across three source laptops, minutes | 0:45 to 3:26 | hands-on lab test of four migration tools moving a standardised 100 GB data set from three older laptops to new Dell XPS 13 9300 and Lenovo ThinkPad L14 laptops over Wi-Fi (testing concluded 21 July 2020) · United States (lab) · 2020-07 |
| Measure (IDC white paper for Dell, February 2012) | US dollars |
|---|---|
| Average deployment cost per PC | $615 |
| Costs 'not uncommon' at the high end | over $700 |
| Basic maturity: total cost per PC | $795 per PC |
| Dynamic maturity: total cost per PC | $373 per PC |
| Saving per PC from a mature process | $337 (55%) per PC |
| Worldwide average per PC in the paper's table (of which IT labour $436) | $578 per PC |
| Lost user productivity per PC deployed | $51 per PC |
| Study, year, sample and measure | Figure | Scope |
|---|---|---|
| 2013, Intel, 736 small businesses in six countries: owning PCs over four years old | 36% | 736 small businesses (1 to 99 employees) in Brazil, China, Germany, India, Russia and the United States (Intel Small Business PC Refresh Study by Techaisle, April 2013) · Brazil, China, Germany, India, Russia, United States · 2013-04 |
| 2013, Intel: extra hours lost per year on a PC four years or older | 21 hours | 736 small businesses (1 to 99 employees) in Brazil, China, Germany, India, Russia and the United States (Intel Small Business PC Refresh Study by Techaisle, April 2013) · Brazil, China, Germany, India, Russia, United States · 2013-04 |
| 2013, Intel: working hours lost when an older PC needs repair | 42 hours | 736 small businesses (1 to 99 employees) in Brazil, China, Germany, India, Russia and the United States (Intel Small Business PC Refresh Study by Techaisle, April 2013) · Brazil, China, Germany, India, Russia, United States · 2013-04 |
| 2013, Intel: average repair cost per older PC | $427 per PC | 736 small businesses (1 to 99 employees) in Brazil, China, Germany, India, Russia and the United States (Intel Small Business PC Refresh Study by Techaisle, April 2013) · Brazil, China, Germany, India, Russia, United States · 2013-04 |
| 2013, Techaisle: total annual maintenance per older PC, repairs plus upgrades | $561 per PC | 736 small businesses (1 to 99 employees) in Brazil, China, Germany, India, Russia and the United States (Intel Small Business PC Refresh Study by Techaisle, April 2013) · Brazil, China, Germany, India, Russia, United States · 2013-04 |
| 2013, Techaisle: citing lack of budget for not replacing older PCs | 47% | 736 small businesses (1 to 99 employees) in Brazil, China, Germany, India, Russia and the United States (Intel Small Business PC Refresh Study by Techaisle, April 2013) · Brazil, China, Germany, India, Russia, United States · 2013-04 |
| 2013, Intel: unaware that Windows XP support was ending | 47% | 736 small businesses (1 to 99 employees) in Brazil, China, Germany, India, Russia and the United States (Intel Small Business PC Refresh Study by Techaisle, April 2013) · Brazil, China, Germany, India, Russia, United States · 2013-04 |
| 2018, Microsoft and Intel, 2,156 Asia Pacific SMBs: with PCs older than four years | 7 in 10 | 2,156 SMB IT and business decision makers in Australia, India, Indonesia, Japan and South Korea (Techaisle 'Make the Shift' study for Microsoft and Intel, August 2018) · Asia Pacific (Australia, India, Indonesia, Japan, South Korea) · 2018-08 |
| 2018: larger SMBs with older PCs, against smaller ones | 85% vs 60% | 2,156 SMB IT and business decision makers in Australia, India, Indonesia, Japan and South Korea (Techaisle 'Make the Shift' study for Microsoft and Intel, August 2018) · Asia Pacific (Australia, India, Indonesia, Japan, South Korea) · 2018-08 |
| 2018: SMB PCs still on older versions of Windows | 42% | 2,156 SMB IT and business decision makers in Australia, India, Indonesia, Japan and South Korea (Techaisle 'Make the Shift' study for Microsoft and Intel, August 2018) · Asia Pacific (Australia, India, Indonesia, Japan, South Korea) · 2018-08 |
| 2018: how much more likely a PC over four years old is to need repair | 2.7x | 2,156 SMB IT and business decision makers in Australia, India, Indonesia, Japan and South Korea (Techaisle 'Make the Shift' study for Microsoft and Intel, August 2018) · Asia Pacific (Australia, India, Indonesia, Japan, South Korea) · 2018-08 |
| 2018: hours lost per year to downtime on an older PC (3.1 times a newer one) | 112 hours | 2,156 SMB IT and business decision makers in Australia, India, Indonesia, Japan and South Korea (Techaisle 'Make the Shift' study for Microsoft and Intel, August 2018) · Asia Pacific (Australia, India, Indonesia, Japan, South Korea) · 2018-08 |
| 2018: annual cost of keeping a PC older than four years | $2,736 per PC | 2,156 SMB IT and business decision makers in Australia, India, Indonesia, Japan and South Korea (Techaisle 'Make the Shift' study for Microsoft and Intel, August 2018) · Asia Pacific (Australia, India, Indonesia, Japan, South Korea) · 2018-08 |
| 2018: older PCs likely to be replaced, though 85% of SMBs planned to | 24% | 2,156 SMB IT and business decision makers in Australia, India, Indonesia, Japan and South Korea (Techaisle 'Make the Shift' study for Microsoft and Intel, August 2018) · Asia Pacific (Australia, India, Indonesia, Japan, South Korea) · 2018-08 |
| 2018: SMBs that dropped a replacement policy or keep PCs longer | 59% | 2,156 SMB IT and business decision makers in Australia, India, Indonesia, Japan and South Korea (Techaisle 'Make the Shift' study for Microsoft and Intel, August 2018) · Asia Pacific (Australia, India, Indonesia, Japan, South Korea) · 2018-08 |
| 2018, Microsoft Australia and Intel, 415 Australian SMBs: annual cost of keeping an older PC | AU$5,012 per PC | 415 SMB organisations in Australia (Techaisle study for Microsoft and Intel, 2018) · Australia · 2018-08 |
| 2019, Techaisle for Microsoft, New Zealand SMBs: with no PC refresh policy | 42% | New Zealand SMBs within a Techaisle and Microsoft survey of 2,000 SMBs across Asia Pacific (2019) · New Zealand · 2019-09 |
| 2019, New Zealand: repair odds of an older PC (at least NZ$4,000 and 157 hours a year) | 3.1x | New Zealand SMBs within a Techaisle and Microsoft survey of 2,000 SMBs across Asia Pacific (2019) · New Zealand · 2019-09 |
| 2020, Techaisle for Microsoft, 2,085 SMBs: with no PC refresh policy (32% of their Windows 10 PCs were four or more years old) | 40% | business and technology decision makers at 2,085 SMBs (25 to 499 seats) worldwide (Techaisle global study sponsored by Microsoft, 2020) · Worldwide · 2020 |
| 2020: frequency of problems on a Windows 10 PC four or more years old, against newer | 4.5x | business and technology decision makers at 2,085 SMBs (25 to 499 seats) worldwide (Techaisle global study sponsored by Microsoft, 2020) · Worldwide · 2020 |
| 2020: lost productivity per older Windows 10 PC per year (3.8 times a newer one) | $1,193 per PC | business and technology decision makers at 2,085 SMBs (25 to 499 seats) worldwide (Techaisle global study sponsored by Microsoft, 2020) · Worldwide · 2020 |
| 2020: total cost of a Windows 10 PC four or more years old per year (3.3 times a newer one) | $1,525 per PC | business and technology decision makers at 2,085 SMBs (25 to 499 seats) worldwide (Techaisle global study sponsored by Microsoft, 2020) · Worldwide · 2020 |
| 2020: productive hours lost per older Windows 10 PC per year | 70 hours | business and technology decision makers at 2,085 SMBs (25 to 499 seats) worldwide (Techaisle global study sponsored by Microsoft, 2020) · Worldwide · 2020 |
| Survey year, population and threshold | Share of respondents | Scope |
|---|---|---|
| 2013, ITIC, large enterprises over 1,000 employees: over $100,000 | 95% | Large enterprises with more than 1,000 employees among over 600 organisations polled by ITIC in its 2013-2014 Technology Trends and Deployment Survey, May/June 2013 · Worldwide · 2013 |
| 2013, ITIC, large enterprises: over $300,000 | over 50% | Large enterprises with more than 1,000 employees among over 600 organisations polled by ITIC in its 2013-2014 Technology Trends and Deployment Survey, May/June 2013 · Worldwide · 2013 |
| 2013, ITIC, large enterprises: $1 million or more | 11% | Large enterprises with more than 1,000 employees among over 600 organisations polled by ITIC in its 2013-2014 Technology Trends and Deployment Survey, May/June 2013 · Worldwide · 2013 |
| 2014, ITIC (as restated in its 2019 post): over $300,000 | 76% | Respondents to ITIC's 2014 hourly cost of downtime polling (sample not given in the 2019 post) · Worldwide · 2014 |
| 2016, ITIC: over $100,000 | 98% | Organisations responding to ITIC's 2016 reliability and hourly cost of downtime survey (sample not stated in the post; ITIC's co-branded report of the same findings cites over 709 businesses) · Worldwide · 2016 |
| 2016, ITIC: over $300,000 | 81% | Organisations responding to ITIC's 2016 reliability and hourly cost of downtime survey (sample not stated in the post; ITIC's co-branded report of the same findings cites over 709 businesses) · Worldwide · 2016 |
| 2016, ITIC, enterprises: $1 million or more | 33% | Organisations responding to ITIC's 2016 reliability and hourly cost of downtime survey (sample not stated in the post; ITIC's co-branded report of the same findings cites over 709 businesses) · Worldwide · 2016 |
| 2016, ITIC poll of 709 businesses in August and September (report hosted by KnowBe4): over $300,000 | 81% | Over 709 businesses polled by ITIC in August/September 2016 (567 North American, 142 international; SMBs 32%, SMEs 31%, enterprises 37%; 47 vertical markets), in a report co-branded with KnowBe4 · Worldwide (80% North America) · 2016-08 to 2016-09 |
| 2017, ITIC, over 800 organisations: over $300,000 | 81% | Over 800 organisations polled by ITIC in its 2017 Reliability and Hourly Cost of Downtime Trends Survey, April/May 2017 · Worldwide · 2017 |
| 2017, ITIC, enterprises: $1 million or more | 33% | Over 800 organisations polled by ITIC in its 2017 Reliability and Hourly Cost of Downtime Trends Survey, April/May 2017 · Worldwide · 2017 |
| 2017, ITIC, enterprises: under $100,000 | 2% | Over 800 organisations polled by ITIC in its 2017 Reliability and Hourly Cost of Downtime Trends Survey, April/May 2017 · Worldwide · 2017 |
| 2017, ITIC, SMBs of 1 to 150 employees: over $100,000 | 47% | Over 800 organisations polled by ITIC in its 2017 Reliability and Hourly Cost of Downtime Trends Survey, April/May 2017 · Worldwide · 2017 |
| 2018, ITIC (as restated in its 2019 post): over $300,000 | 81% | Respondents to ITIC's 2018 hourly cost of downtime polling (sample not given in the 2019 post) · Worldwide · 2018 |
| 2019, ITIC, over 1,000 firms: at least $100,000 | 98% | Over 1,000 businesses worldwide polled by ITIC in its 2019 Global Server Hardware, Server OS Reliability Survey, November 2018 through January 2019 · Worldwide · 2019 |
| 2019, ITIC: $300,000 or higher | 86% | Over 1,000 businesses worldwide polled by ITIC in its 2019 Global Server Hardware, Server OS Reliability Survey, November 2018 through January 2019 · Worldwide · 2019 |
| 2019, ITIC: $1 million or more | 34% | Over 1,000 businesses worldwide polled by ITIC in its 2019 Global Server Hardware, Server OS Reliability Survey, November 2018 through January 2019 · Worldwide · 2019 |
| 2020, ITIC, large enterprises over 1,000 employees: over $100,000 | 98% | 1,000 businesses polled by ITIC from March through June 2020 (27% SMBs up to 200 users, 28% SMEs 201 to 1,000 users, 45% large enterprises over 1,000 users) · Worldwide · 2020 |
| 2020, ITIC, enterprises: $1 million or more | 40% | 1,000 businesses polled by ITIC from March through June 2020 (27% SMBs up to 200 users, 28% SMEs 201 to 1,000 users, 45% large enterprises over 1,000 users) · Worldwide · 2020 |
| 2021, ITIC, 1,200 organisations: over $300,000 | 91% | Over 1,200 organisations worldwide polled by ITIC in its 2021 Hourly Cost of Downtime Survey, January through July 2021 · Worldwide · 2021 |
| 2021, ITIC, enterprises: over $1 million | 44% | Over 1,200 organisations worldwide polled by ITIC in its 2021 Hourly Cost of Downtime Survey, January through July 2021 · Worldwide · 2021 |
| 2022, ITIC, SMEs and large enterprises: over $300,000 | 91% | 1,300 businesses worldwide polled by ITIC in its 2022 Global Server Hardware Security survey (cost figures restated from ITIC's latest hourly cost of downtime research) · Worldwide · 2022 |
| 2022, ITIC, mid-sized and large enterprises: over $1 million | 44% | 1,300 businesses worldwide polled by ITIC in its 2022 Global Server Hardware Security survey (cost figures restated from ITIC's latest hourly cost of downtime research) · Worldwide · 2022 |
| 2024, ITIC, large enterprises over 1,000 employees: over $100,000 | 97% | Over 1,000 firms worldwide polled by ITIC in its 2024 Hourly Cost of Downtime Survey (its 11th), November 2023 through mid-March 2024 (27% SMBs, the rest SMEs and large enterprises) · Worldwide · 2024 |
| 2024, ITIC, mid-size and large enterprises: over $300,000 | over 90% | Over 1,000 firms worldwide polled by ITIC in its 2024 Hourly Cost of Downtime Survey (its 11th), November 2023 through mid-March 2024 (27% SMBs, the rest SMEs and large enterprises) · Worldwide · 2024 |
| 2024, ITIC, enterprises: $1 million or more | 41% | Over 1,000 firms worldwide polled by ITIC in its 2024 Hourly Cost of Downtime Survey (its 11th), November 2023 through mid-March 2024 (27% SMBs, the rest SMEs and large enterprises) · Worldwide · 2024 |
| 2024, ITIC, enterprises: under $100,000 | 4% | Over 1,000 firms worldwide polled by ITIC in its 2024 Hourly Cost of Downtime Survey (its 11th), November 2023 through mid-March 2024 (27% SMBs, the rest SMEs and large enterprises) · Worldwide · 2024 |

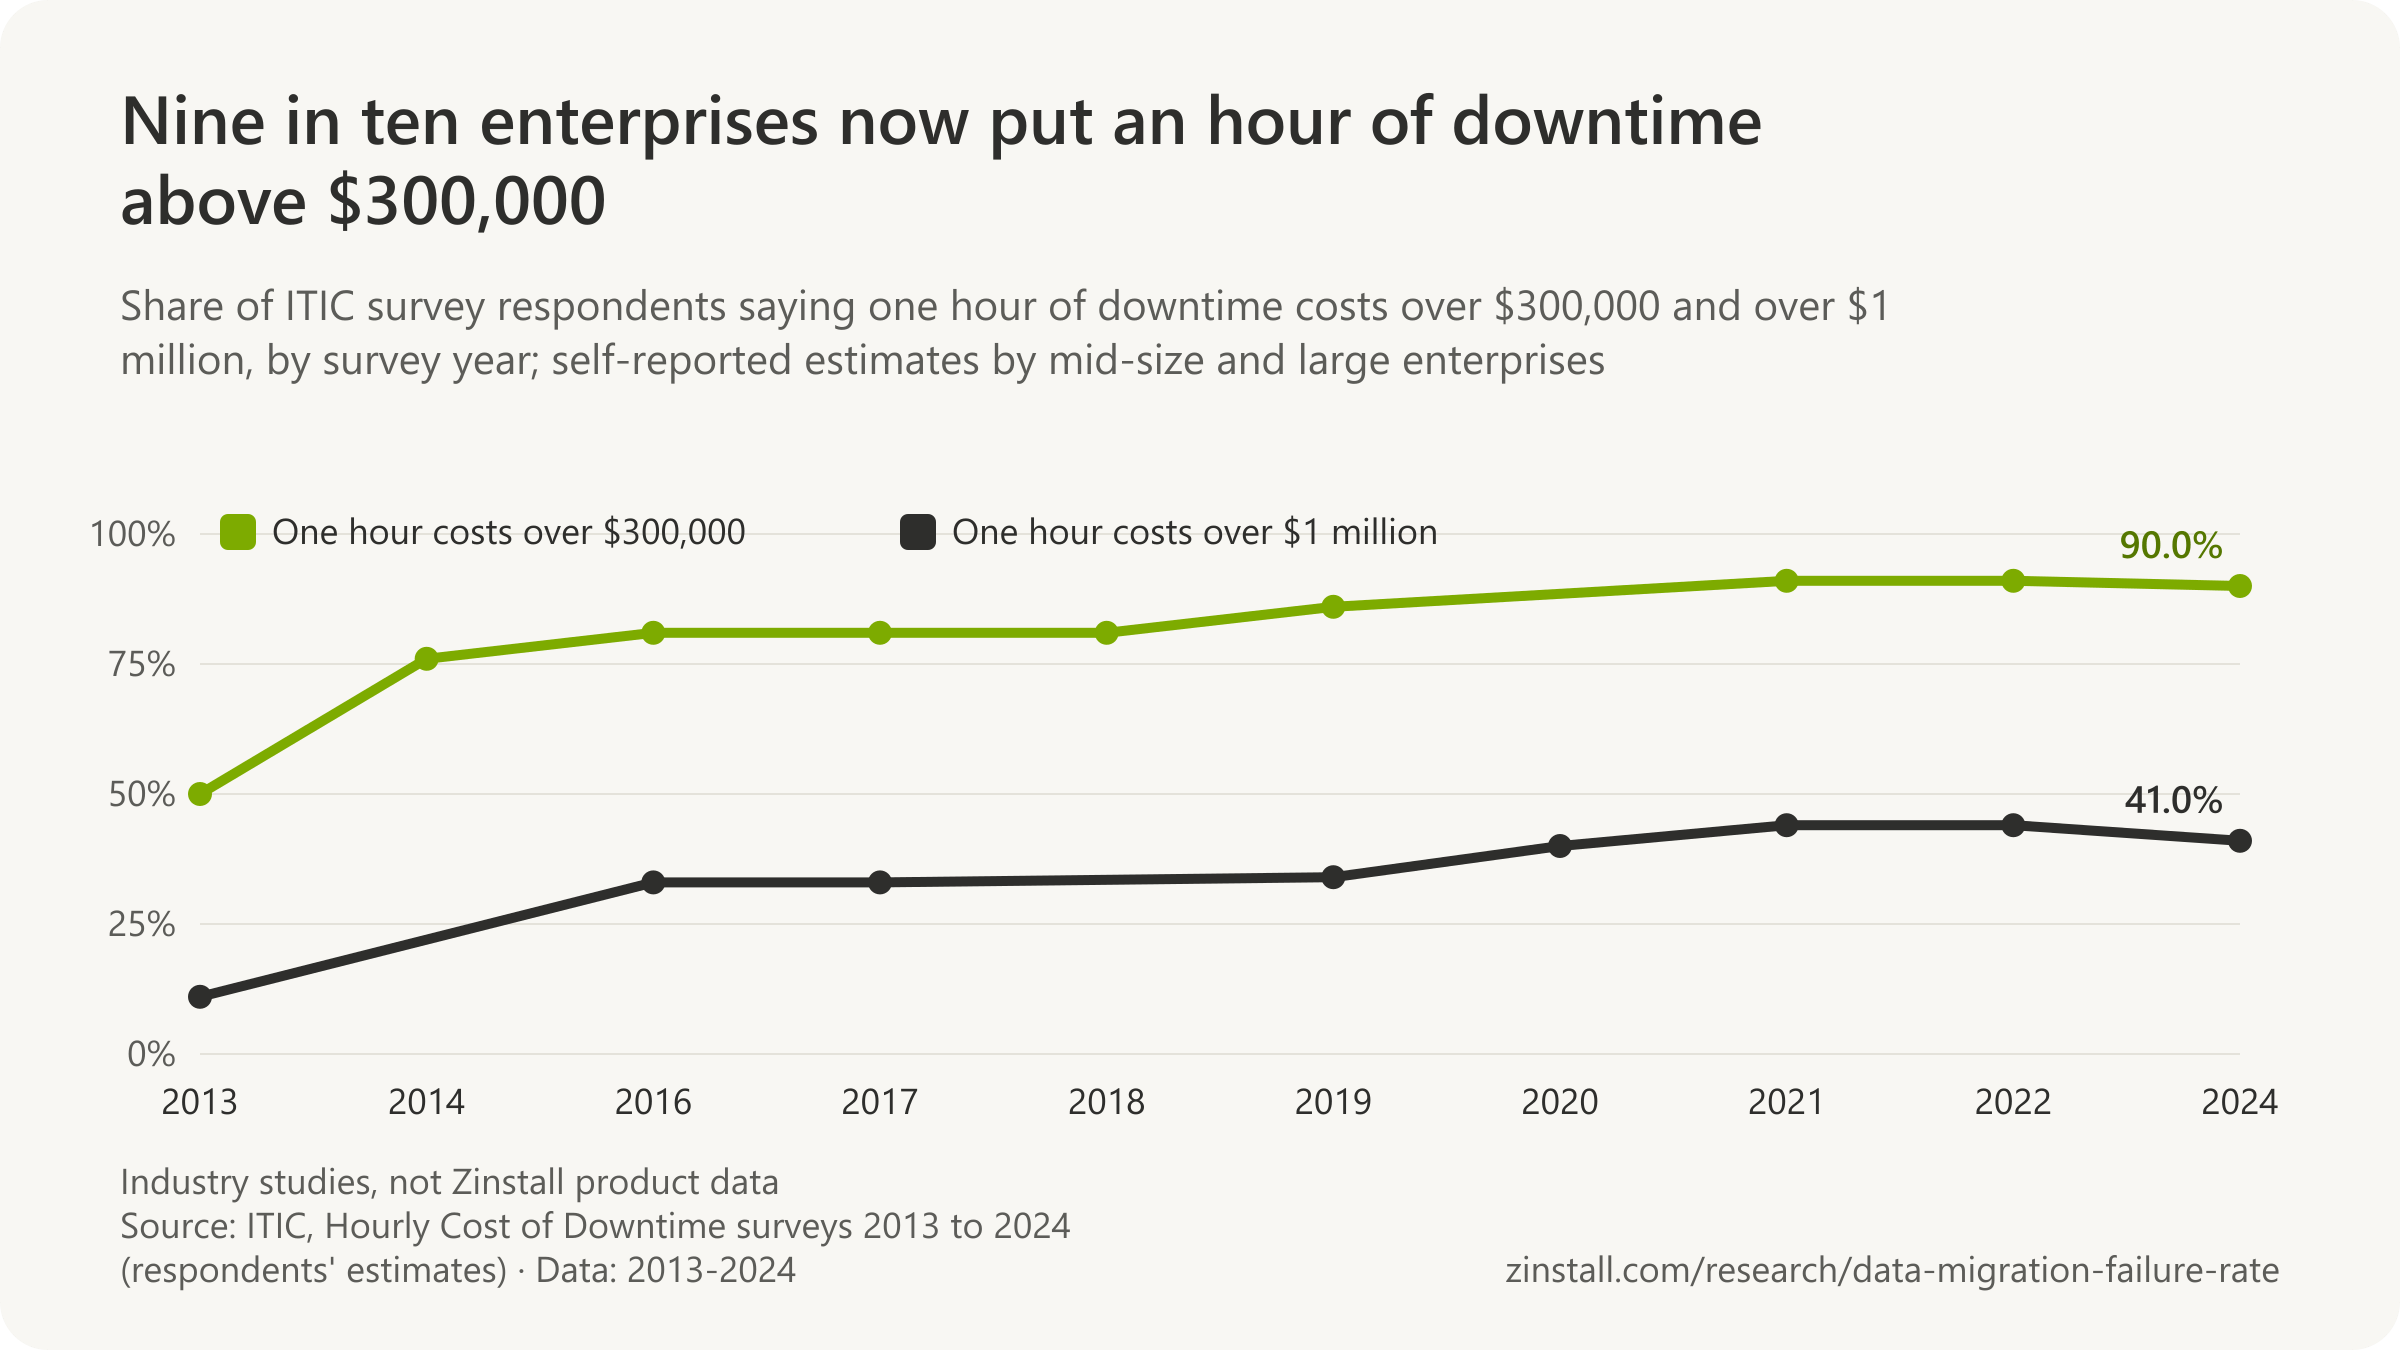
| Survey year and measure | Figure | Scope |
|---|---|---|
| 2019 survey (restated in the 2022 release): failures costing over $100,000 | 39% | Outages reported by data-centre managers and operators in Uptime Institute's 2019 global survey (n=420 for the cost question per the 2023 report's Figure 16) · Worldwide · 2019 survey (restated 2022) |
| 2019 survey: over $1 million | 11% | Outages reported by data-centre managers and operators in Uptime Institute's 2019 global survey · Worldwide · 2019 survey (restated 2022) |
| 2019 survey (via The Register): major outage costs below $100,000 | 60% | Respondents to Uptime Institute's 2019 global survey answering the most-recent-outage cost question (n=420) · Worldwide · 2019 survey (restated 2023) |
| 2019 and 2020 surveys: respondents answering the cost question | n=420 (2019), n=146 (2020) | Respondents to Uptime Institute's 2022 Global Survey of IT and Data Center Managers who had a downtime incident, answering 'Please estimate the total cost of your most recent downtime incident (from outage to full recovery)' · Worldwide · 2019 and 2020 surveys |
| 2020 survey: had an outage in the past three years | 3 in 4 | Data-centre operators and enterprise IT managers responding to Uptime Institute's 2020 global survey · Worldwide · 2020 survey (published 2021) |
| 2020 survey: most recent significant outage cost over $100,000 | over half | Respondents to Uptime Institute's 2020 Global Survey of Data Center and IT Managers who reported an outage in the past three years · Worldwide · 2020 survey (published 2021) |
| 2020 survey: $1 million or above | almost 1 in 3 | Respondents to Uptime Institute's 2020 Global Survey of Data Center and IT Managers who reported an outage in the past three years · Worldwide · 2020 survey (published 2021) |
| 2020 survey: most recent outage preventable with better management | 75% | Respondents to Uptime Institute's 2020 annual survey who had an outage in the last three years · Worldwide · 2020 survey (published 2021) |
| 2021 survey: had an outage in the past three years | 80% | Data-centre managers and operators responding to Uptime Institute's 2021 global survey · Worldwide · 2021 survey (published 2022) |
| 2021 survey: failures costing at least $100,000 | over 60% | Outages reported by data-centre managers and operators in Uptime Institute's 2021 global survey (the release does not give the base) · Worldwide · 2021 survey (published 2022) |
| 2021 survey: over $1 million | 15% | Outages reported by data-centre managers and operators in Uptime Institute's 2021 global survey · Worldwide · 2021 survey (published 2022) |
| 2022 survey (via The Register, which gives 78% for 2020 and 69% for 2021): had an outage in the past three years | 60% | Respondents to Uptime Institute's 2022 annual global survey of IT and data-centre managers · Worldwide · 2022 survey (published 2023) |
| 2022 survey: most recent outage cost over $100,000 | more than 2 in 3 | Respondents to Uptime Institute's 2022 Global Survey of IT and Data Center Managers who had a downtime incident, answering 'Please estimate the total cost of your most recent downtime incident (from outage to full recovery)' · Worldwide · 2022 survey (published 2023) |
| 2022 survey: between $100,000 and $1 million | 45% | Respondents to Uptime Institute's 2022 Global Survey of IT and Data Center Managers who had a downtime incident, answering 'Please estimate the total cost of your most recent downtime incident (from outage to full recovery)' · Worldwide · 2022 survey (published 2023) |
| 2022 survey: over $1 million | 25% | Respondents to Uptime Institute's 2022 Global Survey of IT and Data Center Managers who had a downtime incident, answering 'Please estimate the total cost of your most recent downtime incident (from outage to full recovery)' · Worldwide · 2022 survey (published 2023) |
| 2023 survey: most recent significant, serious or severe outage cost over $100,000 | 54% | Respondents to the 2023 Uptime Institute data center survey who had a significant, serious or severe outage, answering the most-recent-outage cost question · Worldwide · 2023 survey (published 2024) |
| 2023 survey: over $1 million | 16% | Respondents to the 2023 Uptime Institute data center survey who had a significant, serious or severe outage, answering the most-recent-outage cost question · Worldwide · 2023 survey (published 2024) |
| 2023 survey: preventable with better management | 4 in 5 | Respondents to the 2023 Uptime Institute data center survey who had a significant, serious or severe outage, answering the most-recent-outage cost question · Worldwide · 2023 survey (published 2024) |
| 2024 survey: over $100,000 | 54% | Respondents to Uptime Institute's 2024 annual survey who had a significant, serious or severe outage, answering the most-recent-outage cost question (n=91 per the 2026 report's Figure 16) · Worldwide · 2024 survey (published 2025) |
| 2024 survey: over $1 million | 1 in 5 | Respondents to Uptime Institute's 2024 annual survey who had a significant, serious or severe outage, answering the most-recent-outage cost question (n=91 per the 2026 report's Figure 16) · Worldwide · 2024 survey (published 2025) |
| 2025 survey: most recent major or impactful outage cost over $100,000 | 57% | Respondents to the Uptime Institute Global Data Center Survey 2025 who had an impactful outage, answering 'Estimate the total cost of this downtime incident (from outage to full recovery), including direct, opportunity and reputation costs' (n=94) · Worldwide · 2025 survey (published 2026) |
| 2025 survey: over $1 million | 1 in 5 | Respondents to the Uptime Institute Global Data Center Survey 2025 who had an impactful outage, answering 'Estimate the total cost of this downtime incident (from outage to full recovery), including direct, opportunity and reputation costs' (n=94) · Worldwide · 2025 survey (published 2026) |
| 2025 survey: respondents answering the cost question | n=94 | Respondents to the Uptime Institute Global Data Center Survey 2025 who had an impactful outage, answering 'Estimate the total cost of this downtime incident (from outage to full recovery), including direct, opportunity and reputation costs' (n=94) · Worldwide · 2025 survey (published 2026) |
| 2025 survey: last outage had serious or severe impacts | 1 in 10 | Respondents to the Uptime Institute Global Data Center Survey 2025 · Worldwide · 2025 survey (published 2026) |

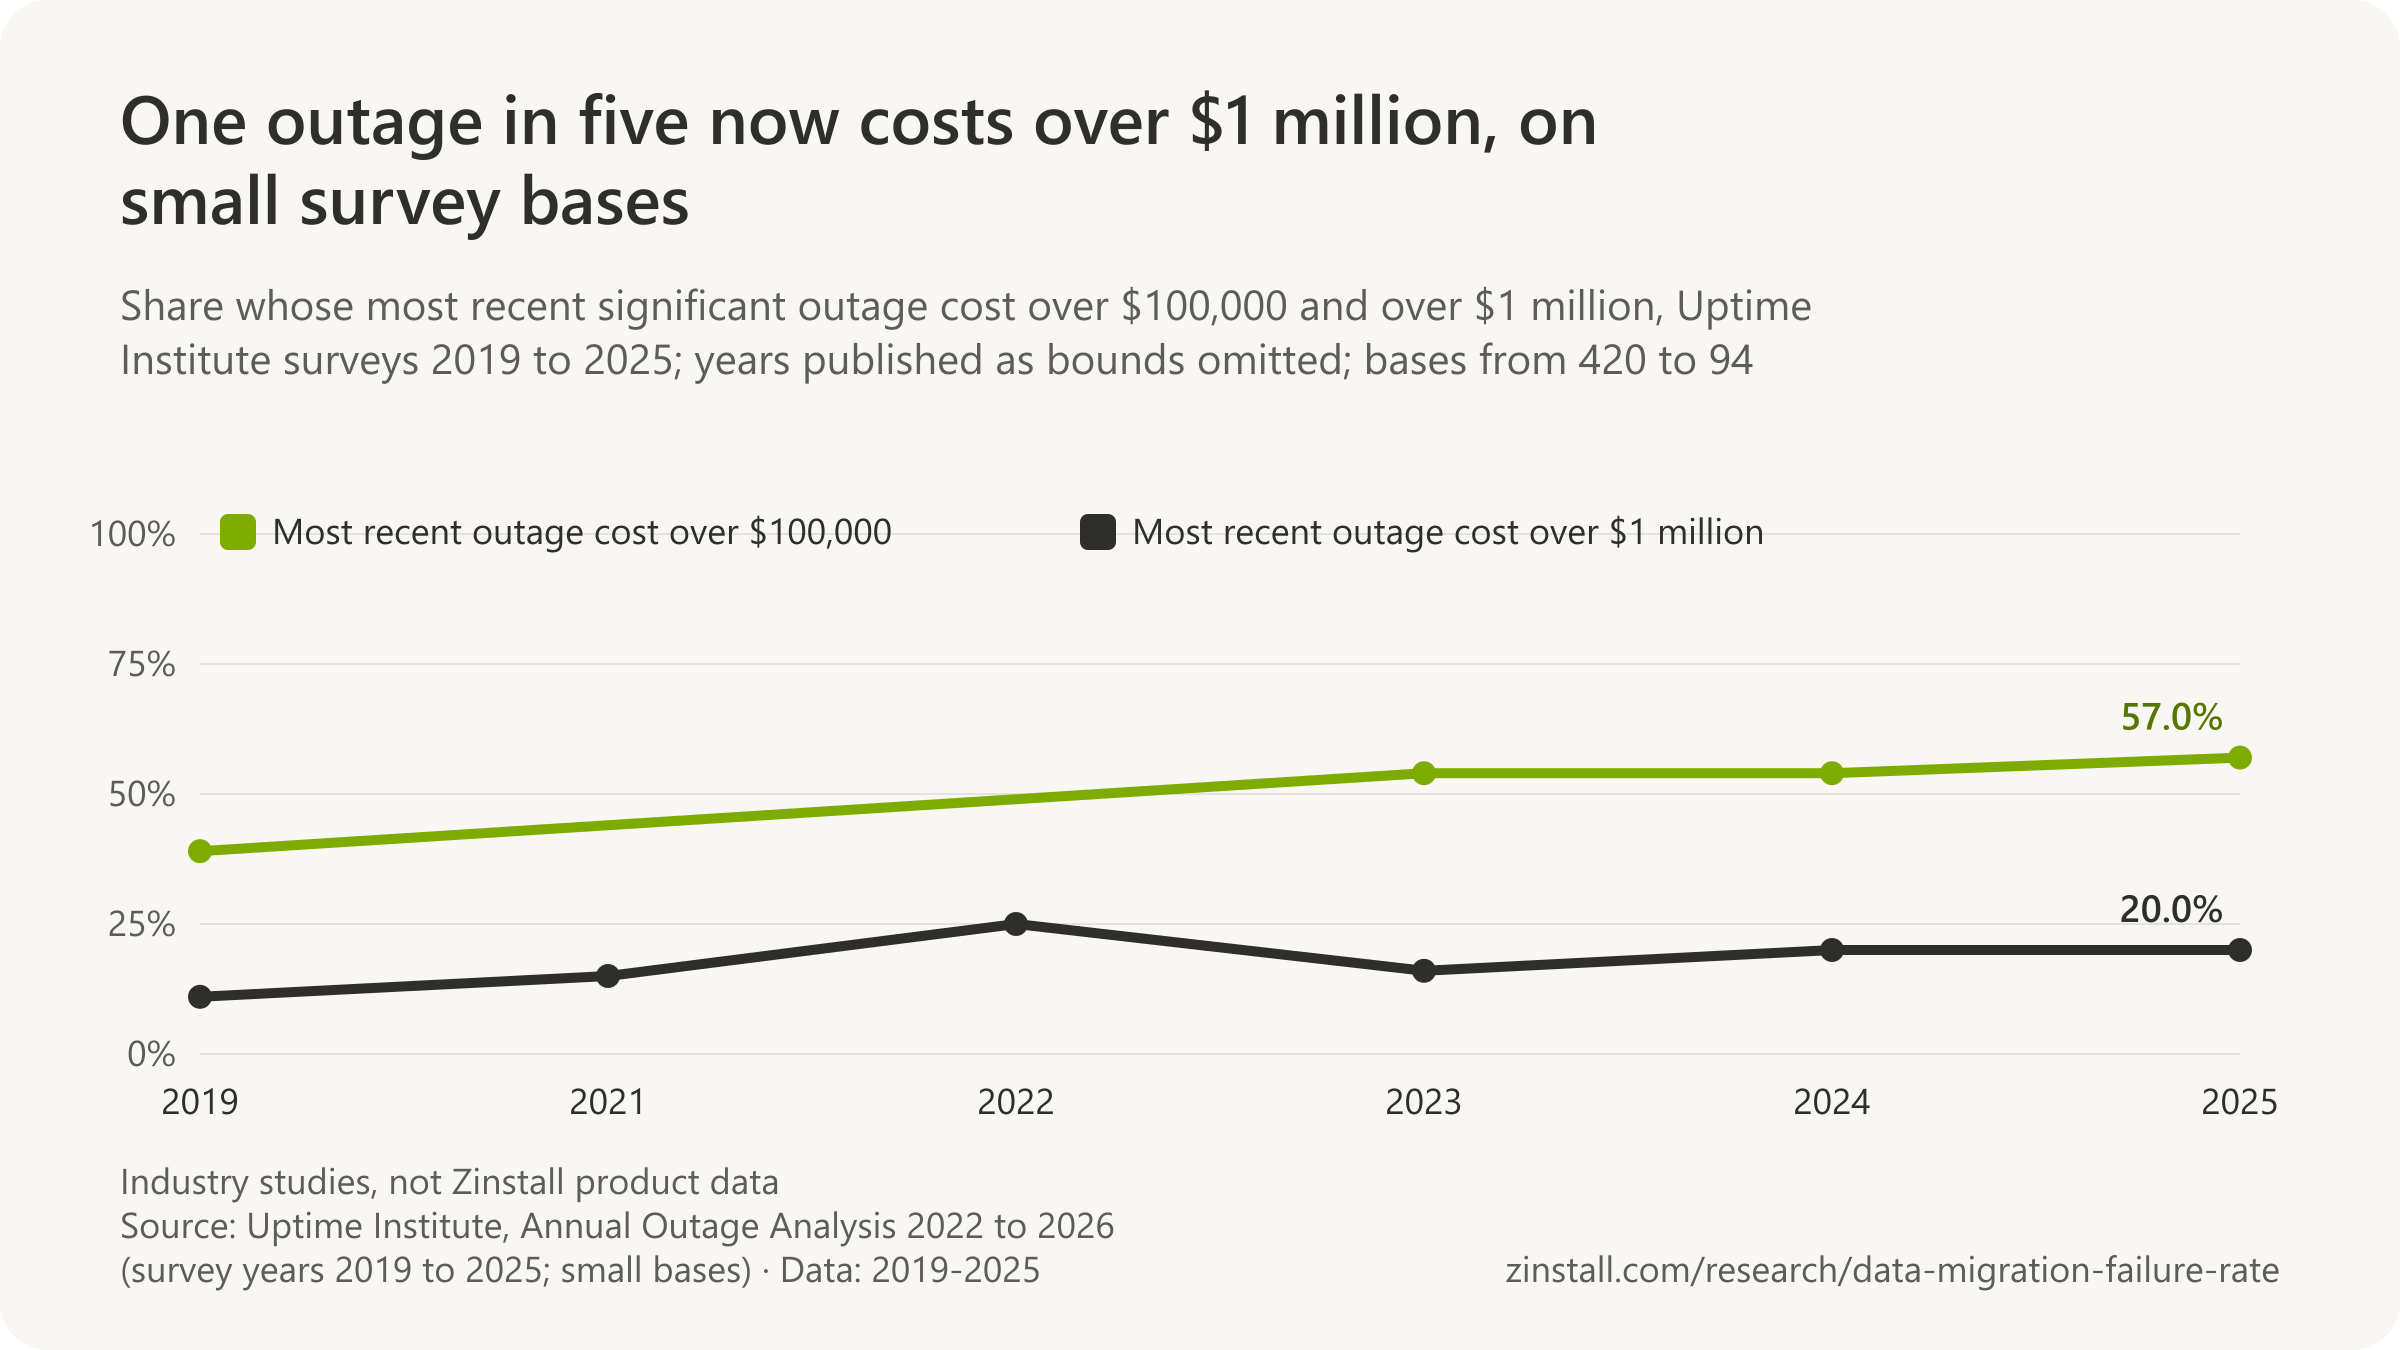
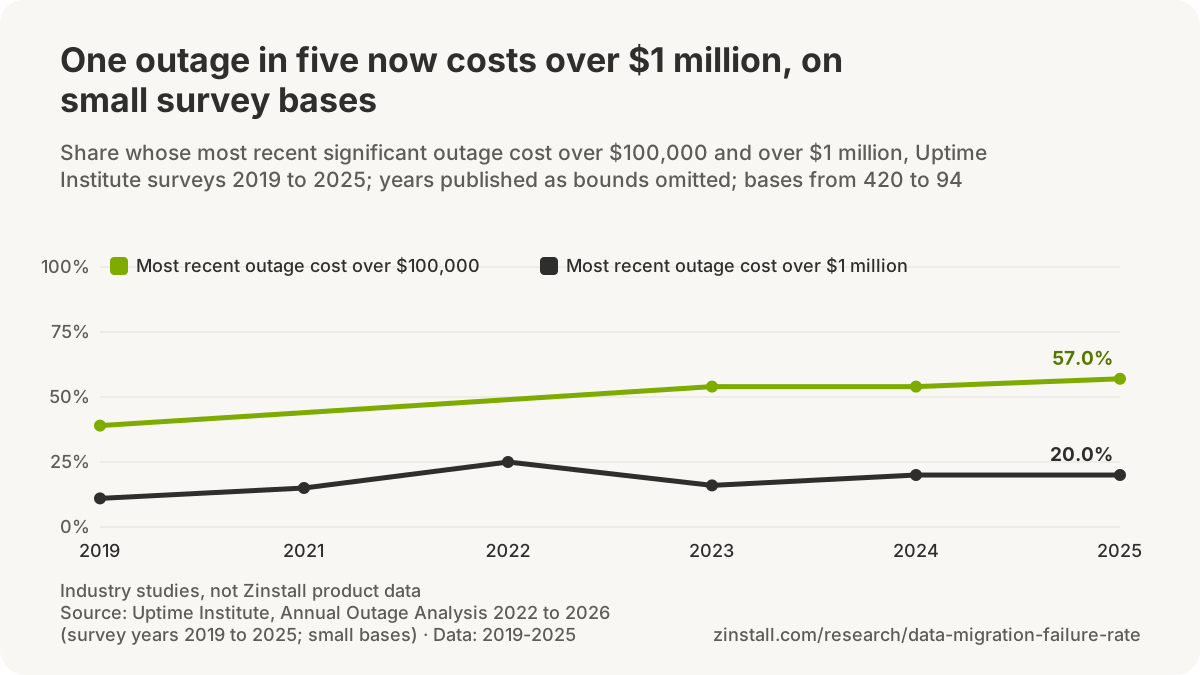
| Study year and measure | US dollars | Scope |
|---|---|---|
| 2010: average cost of an unplanned outage | $505,502 | US data-centre organisations benchmarked by the Ponemon Institute for Emerson Network Power (2010 study; sample not given in the 2016 release) · United States · 2010 |
| 2013: average cost of an unplanned outage | $690,204 | US data-centre organisations benchmarked by the Ponemon Institute for Emerson Network Power (2013 study; sample not given in the 2016 release) · United States · 2013 |
| 2016: average cost of an unplanned outage | $740,357 | 63 US data-centre organisations that had experienced an outage in the previous 12 months, benchmarked by the Ponemon Institute for Emerson Network Power (now Vertiv) in the 2016 Cost of Data Center Outages study · United States · 2016 (study published January 2016) |
| 2010: average cost per minute | $5,617/min | US data-centre organisations benchmarked by the Ponemon Institute for Emerson Network Power (2010 study) · United States · 2010 |
| 2013: average cost per minute | $7,908/min | US data-centre organisations benchmarked by the Ponemon Institute for Emerson Network Power (2013 study) · United States · 2013 |
| 2016: average cost per minute | $8,851/min | 63 US data-centre organisations that had experienced an outage in the previous 12 months, benchmarked by the Ponemon Institute for Emerson Network Power (now Vertiv) in the 2016 Cost of Data Center Outages study · United States · 2016 (study published January 2016) |
| 2016: most expensive single outage | $2.4 million | 63 US data-centre organisations that had experienced an outage in the previous 12 months, benchmarked by the Ponemon Institute for Emerson Network Power (now Vertiv) in the 2016 Cost of Data Center Outages study · United States · 2016 (study published January 2016) |
| 2016: data centres surveyed | 63 data centres | 63 US data-centre organisations that had experienced an outage in the previous 12 months, benchmarked by the Ponemon Institute for Emerson Network Power (now Vertiv) in the 2016 Cost of Data Center Outages study · United States · 2016 (study published January 2016) |
Sources: IDC; Laplink and Intel; Gartner; Principled Technologies (2020); Symantec (2010); Techaisle (2014, 2018, 2020); Microsoft and Intel; Intel; Bloor Research (2007, 2011); Information Architecture Team; Spiceworks; ITIC (2013-2024); Uptime Institute (2021-2026); Ponemon Institute for Emerson Network Power; Enterprise Management Associates; Atlassian; Dotcom-Monitor; Adaptiva; Microsoft Australia and Intel; Techaisle and Microsoft; The Register
How do data migrations compare with IT projects in general?
Industry studies of migration projects; none of these figures measures Zinstall's products.
1 in 6 IT projects was a 'black swan' with a 200% average cost overrun, in a study of 1,471 projects (Flyvbjerg and Budzier, 2011).

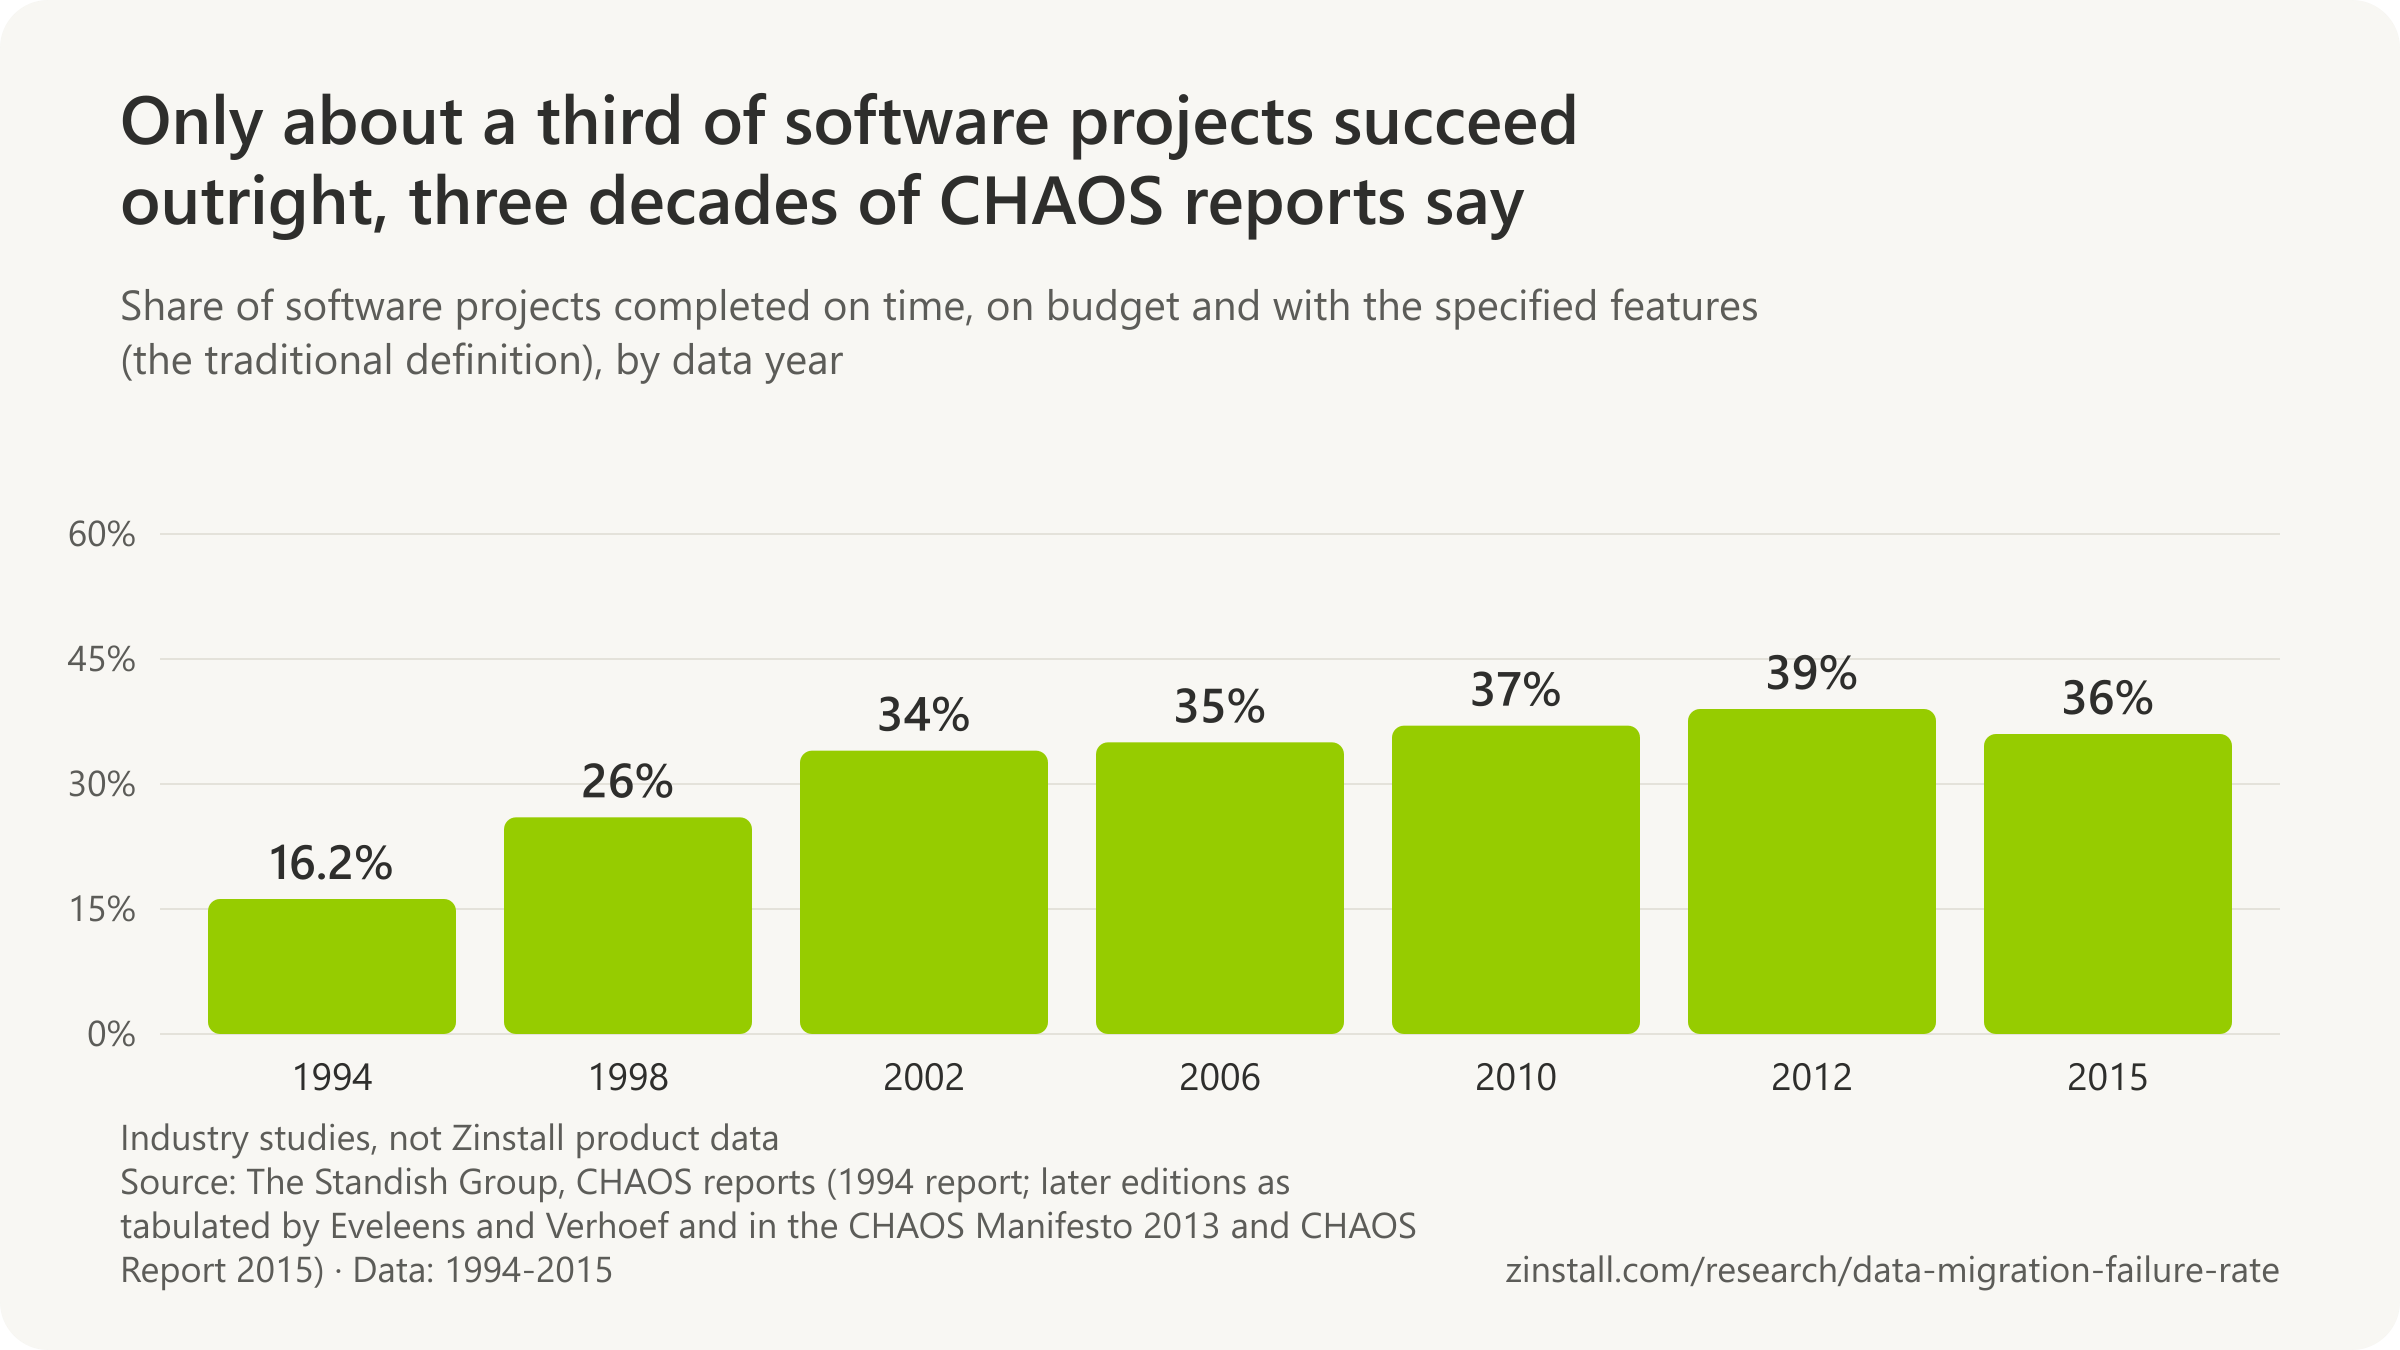
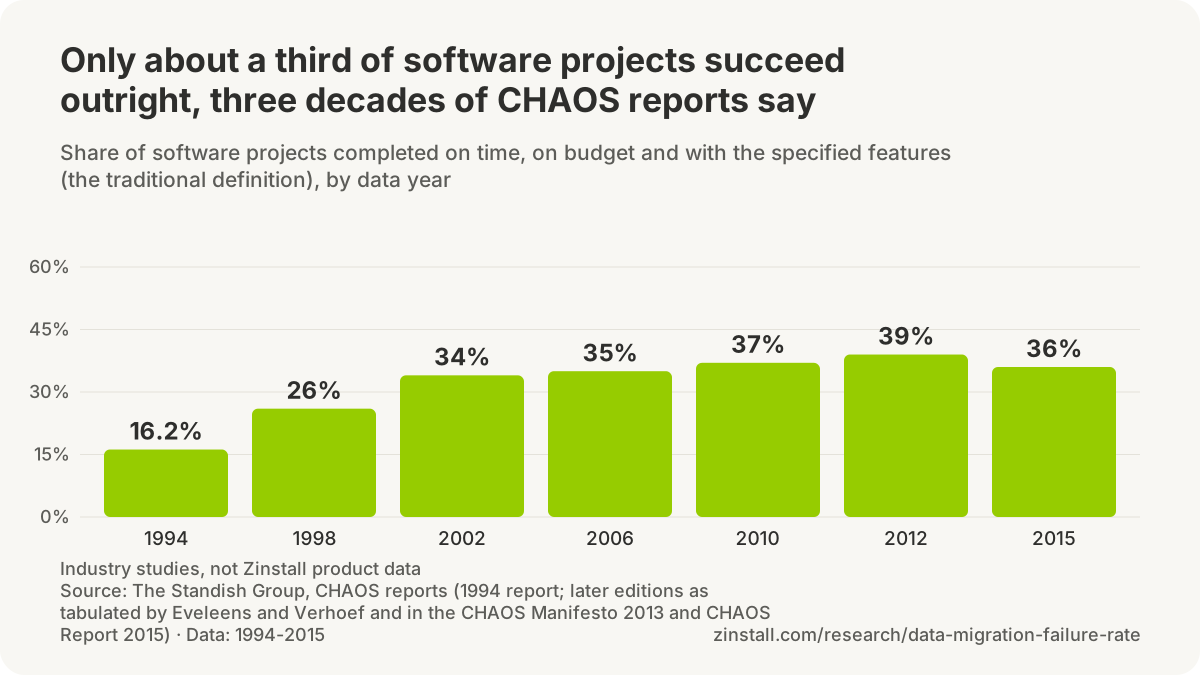
- 19% of projects failed outright and 50% were challenged in the Standish Group's 2020 report.
- Large IT projects ran 45% over budget on average and delivered 56% less value than predicted, in a 2012 study.
- 70% of digital transformations fell short of their objectives, in a 2020 survey of senior executives.
- 9.4% of project investment was wasted through poor performance in 2021, the last year the measure was published.
- Only 19% of organisations delivered successful projects most of the time, in a 2019 survey of project managers.
| Study, year and measure | Figure |
|---|---|
| 2012, McKinsey and Oxford: average schedule overrun | 7% |
| 2012, McKinsey and Oxford: projects that became black swans | 17% |
| 2011, Flyvbjerg and Budzier, 1,471 projects: average cost overrun | 27% |
| 2011, Flyvbjerg and Budzier: average cost overrun of the black swans | 200% |
| 2022, Flyvbjerg and others, 5,392 projects: mean ratio of actual to estimated cost | 1.8x |
| 2021, PMI: projects meeting original goals | 73% |
| 2017, KPMG New Zealand: consistently delivering on benefits | 21% |
| FY2008, US GAO, major federal IT projects: poorly planned or poorly performing | 53% |
Sources: Harvard Business Review; ACM Queue; McKinsey and Company with the University of Oxford; Boston Consulting Group; Project Management Institute; KPMG, AIPM and IPMA; Journal of Management Information Systems; KPMG New Zealand; U.S. Government Accountability Office; The Standish Group (1994-2015)
More statistics (101)
1 in 6 IT projects (one in six) was a 'black swan' with a 200% average cost overrun and almost 70% schedule overrun, in Flyvbjerg and Budzier's study of 1,471 IT projects (Flyvbjerg and Budzier, 2011).
Set the migration surveys beside what is known about IT projects of every kind and they stop looking exceptional. The Standish Group has sorted projects into successful, challenged and failed since the mid-nineties, and its success rate has sat near a third for most of that time; its method is disputed by academics, and it redefined success in 2015, both of which the records carry. The large-sample studies from McKinsey and Oxford find overruns that are moderate on average and catastrophic in a minority, which is why the same researchers later argued that an average IT cost overrun does not exist at all. Consultancies' transformation figures and the Project Management Institute's waste measure fill in the rest. Gartner's famous project-failure percentages, for CRM in 2001 and ERP since, are forecasts, and Gartner's own analyst said so of the CRM one.
- 31% of projects were successful in The Standish Group's CHAOS 2020: Beyond Infinity report, as cited by Varajao and colleagues in ACM Queue (ACM Queue, 2024).
- 50% of projects were challenged in The Standish Group's CHAOS 2020: Beyond Infinity report, as cited by Varajao and colleagues in ACM Queue (ACM Queue, 2024).
- 19% of projects were failed in The Standish Group's CHAOS 2020: Beyond Infinity report, as cited by Varajao and colleagues in ACM Queue (ACM Queue, 2024).
- 16.2% of software projects were completed on time and on budget with all specified features (Resolution Type 1, success) in The Standish Group's 1994 CHAOS survey of 365 IT executives representing 8,380 applications (Standish Group, 1994).
- 189% of the original cost estimate was the average cost of challenged and impaired software projects across all company sizes in The Standish Group's 1994 CHAOS survey (Standish Group, 1994).
- 9% of software projects at large companies (over $500 million revenue) came in on time and on budget in The Standish Group's 1994 CHAOS survey (Standish Group, 1994).
- 2% was the chance of a project with more than $10 million in labor cost coming in on time and on budget in The Standish Group's 2008 figures, against 71% for projects under $750,000 (Standish Group, 2009).
- 6% of grand-size software projects were successful and 43% failed, against 61% successful and 7% failed for small projects, in The Standish Group's CHAOS Report 2015 (Standish Group, 2015).
- 39% of agile software projects were successful against 11% of waterfall projects, and 9% versus 29% failed, across more than 10,000 projects in The Standish Group's CHAOS Report 2015 (Standish Group, 2015).
- 7 percentage points lower was the success rate under The Standish Group's Modern Resolution definition (satisfactory result instead of on target) compared with its Traditional definition, in the CHAOS Report 2015 (Standish Group, 2015).
- 10% of large software projects were successful, against 76% of small projects, in The Standish Group's CHAOS Manifesto 2013 (Standish Group, 2013).
- 76% of small software projects (under $1 million in labor) were successful in The Standish Group's CHAOS Manifesto 2013, with 4% failed (Standish Group, 2013).
- 45% over budget on average were large IT projects (initial budgets above $15 million) in the McKinsey and University of Oxford study of more than 5,400 IT projects (McKinsey, 2012).
- 56% less value than predicted was delivered on average by large IT projects (budgets above $15 million) in the McKinsey and University of Oxford study of more than 5,400 IT projects (McKinsey, 2012).
- 15% higher cost overruns came with every additional year an IT project was scheduled to last, in the McKinsey and University of Oxford study of more than 5,400 IT projects (McKinsey, 2012).
- 200% was the average cost overrun of the one-in-six 'black swan' IT projects in Flyvbjerg and Budzier's study of 1,471 IT projects (Flyvbjerg and Budzier, 2011).
- 70% (almost) was the average schedule overrun of the 'black swan' IT projects in Flyvbjerg and Budzier's study of 1,471 IT projects (Flyvbjerg and Budzier, 2011).
- Power-law (fat-tailed) was the distribution of IT project cost overruns found across 5,392 IT projects completed 2002 to 2014, so a small share of projects carry extreme overruns and no stable average exists (Flyvbjerg et al., 2022).
- 70% of digital transformations fell short of their objectives in BCG's 2020 research based on a survey of 825 senior executives and its work with 70 companies (BCG, 2020).
- 80% was the success rate of digital transformations that got BCG's six success factors right, against 30% overall, in BCG's 2020 analysis of 825 executives' transformations (BCG, 2020).
- 9.4% of investment was wasted due to poor project performance in PMI's Pulse of the Profession 2021 survey of 3,950 project professionals, down from 11.4% in 2020 (PMI, 2021).
- $135 million per $1 billion spent on a failed project was lost 'forever, unrecoverable' according to PMI's Pulse of the Profession 2013 survey of project practitioners (PMI, 2013).
- 17% (about) of projects failed outright and fewer than two-thirds met their goals and business intent, with success rates falling since 2008, in PMI's Pulse of the Profession 2013 (PMI, 2013).
- 19% of organisations delivered successful projects at least most of the time in the KPMG, AIPM and IPMA Project Management Survey 2019 of almost 500 respondents from 57 countries (KPMG/AIPM/IPMA, 2019).
- 56% (more than half) of public companies surveyed worldwide by KPMG had suffered a failed IT project in the previous 12 months, Information Age reported on November 26, 2002 (Information Age, 2002).
- 56% of IT projects fail was how Information Age rendered KPMG's 2002 finding that 56% of surveyed businesses had a failed IT project in 12 months, a drift from share of companies to share of projects (Information Age, 2002).
- 50% (more than) of all CRM implementations would be viewed as failures from a customer's point of view through 2006, Gartner predicted at its CRM Summit on September 10, 2001; a forecast, not a measurement (Gartner, 2001).
- 0 single quantitative studies lay behind Gartner's 2001 CRM failure forecast, which its research director Scott Nelson described in 2002 as 'pieces of studies put together' with no unified definition of failure (CRM Magazine, 2002).
- 80% was the CRM failure rate circulating in 2002 that Gartner's Scott Nelson said applied only to sales-force automation implementations, with 'more than 50 percent' the cross-spectrum figure (CRM Magazine, 2002).
- 70% (more than) of recently implemented ERP initiatives will fail to fully meet their original business goals by 2027, Gartner predicts in its ERP research insight by analyst Denis Torii; a forecast, not a measurement (Gartner, 2024).
- 55% to 75% of ERP projects fail to meet their objectives 'according to Gartner', a Rand Group blog post claims without citing any Gartner document; no such Gartner publication was found (Rand Group, 2024).
- 0 independent research studies, in general, supported the Standish CHAOS failure figures, Robert Glass wrote in Communications of the ACM in 2006, noting Standish had refused to disclose its method (Glass, 2006).
- 189% average cost overrun, the Standish 1994 figure, is 'much too high to reflect the situation in 1994' according to Jorgensen and Molokken-Ostvold's review, which found it inconsistent with other surveys of the period (Jorgensen and Molokken, 2006).
- 50% of 50 randomly sampled web documents described Standish's 1994 result as a '189% cost overrun', 40% as '189% of original estimate' and 10% as an '89% cost overrun', in Jorgensen and Molokken-Ostvold's review (Jorgensen and Molokken, 2006).
- 1,211 real-world projects with 5,457 forecasts were run through Standish's definitions by Eveleens and Verhoef, who found the definitions misleading, one-sided, distorting of estimation practice and productive of meaningless figures (Eveleens and Verhoef, 2010).
- 413 federal IT projects, with at least $25.2 billion of fiscal 2008 spending, were identified by OMB and agencies as poorly planned, poorly performing or both, GAO testified on July 31, 2008 (GAO, 2008).
- 365 IT executive managers, representing 8,380 applications, formed the sample of The Standish Group's 1994 CHAOS survey, supplemented by four focus groups and personal interviews (Standish Group, 1994).
- 222% of the original time estimate was the average schedule of challenged and impaired software projects in The Standish Group's 1994 CHAOS survey (Standish Group, 1994).
- 61% of originally specified features and functions were delivered on average by challenged software projects in The Standish Group's 1994 CHAOS survey (Standish Group, 1994).
- $81 billion was The Standish Group's estimate of what American companies and government agencies would spend on cancelled software projects in 1995, based on its 1994 CHAOS survey (Standish Group, 1994).
- 24% of software projects at Fortune 500 companies came in on time and within budget in 1998, up from 9% in 1994, in The Standish Group's CHAOS research (Standish Group, 1999).
- 23,000 application projects at large, medium and small US companies had been examined by The Standish Group's CHAOS research since 1994, as of its 1999 report (Standish Group, 1999).
- 54% was the average cost overrun of IT projects in The Standish Group's 2008 figures, up from 47% in 2006, with 84% the high point in 2004 (Standish Group, 2009).
- 24% of projects failed in The Standish Group's CHAOS Summary 2009, which its press release of April 23, 2009 called the highest failure rate in over a decade (Standish Group, 2009).
- 400 organizations were surveyed for The Standish Group's CHAOS Summary 2009, according to CIO.com's report of the findings (CIO.com, 2009).
- 25,000-plus software projects, about 5,000 per yearly period, made up The Standish Group's new CHAOS database for fiscal years 2011 to 2015 (Standish Group, 2015).
- 30% of digital transformations met or exceeded their target value with sustainable change (the 'win zone') in BCG's 2020 survey of 825 senior executives (BCG, 2020).
- 26% of digital transformations created less than half of their target value with no sustainable change (the 'woe zone') in BCG's 2020 survey of 825 senior executives (BCG, 2020).
- 75% (as much as 40% to 75%) was the margin by which a majority of businesses would underestimate CRM project costs through 2006, Gartner predicted on September 11, 2001 (Gartner, 2001).
- 50% (more than half) of all companies implementing CRM systems would view those implementations as failures through 2006, as KDnuggets restated Gartner's September 2001 forecast three days later (KDnuggets, 2001).
| Data year, resolution and definition | Share of projects | Scope |
|---|---|---|
| 1994: successful (365 IT executives, 8,380 applications) | 16.2% | IT executive managers at US companies and government agencies surveyed by The Standish Group (365 respondents representing 8,380 applications) · United States · 1994 |
| 1994: challenged | 52.7% | IT executive managers at US companies and government agencies surveyed by The Standish Group (365 respondents representing 8,380 applications) · United States · 1994 |
| 1994: cancelled | 31.1% | IT executive managers at US companies and government agencies surveyed by The Standish Group (365 respondents representing 8,380 applications) · United States · 1994 |
| 1996: successful (as tabulated by Eveleens and Verhoef) | 27% | Projects in The Standish Group's CHAOS database, figures as published by Standish and reproduced in Eveleens and Verhoef, Table 1 · Worldwide · 1996 |
| 1996: failed | 40% | Projects in The Standish Group's CHAOS database, figures as published by Standish and reproduced in Eveleens and Verhoef, Table 1 · Worldwide · 1996 |
| 1998: successful | 26% | Application development projects at large, medium and small US companies in The Standish Group's CHAOS database (23,000 projects by 1999) · United States · 1998 |
| 1998: failed (Eveleens and Verhoef) | 28% | Projects in The Standish Group's CHAOS database, figures as published by Standish and reproduced in Eveleens and Verhoef, Table 1 · Worldwide · 1998 |
| 2000: successful | 28% | IT projects reported to The Standish Group's CHAOS research in the stated year (sample not stated for earlier years) · Worldwide · 2000 |
| 2000: failed | 23% | IT projects reported to The Standish Group's CHAOS research in the stated year (sample not stated for earlier years) · Worldwide · 2000 |
| 2002: successful | 34% | IT projects reported to The Standish Group's CHAOS research in the stated year (sample not stated for earlier years) · Worldwide · 2002 |
| 2002: failed | 15% | IT projects reported to The Standish Group's CHAOS research in the stated year (sample not stated for earlier years) · Worldwide · 2002 |
| 2004: successful | 29% | IT projects reported to The Standish Group's CHAOS research in the stated year (sample not stated for earlier years) · Worldwide · 2004 |
| 2004: failed | 18% | IT projects reported to The Standish Group's CHAOS research in the stated year (sample not stated for earlier years) · Worldwide · 2004 |
| 2006: successful | 35% | IT projects reported to The Standish Group's CHAOS research in the stated year (sample not stated for earlier years) · Worldwide · 2006 |
| 2006: failed | 19% | IT projects reported to The Standish Group's CHAOS research in the stated year (sample not stated for earlier years) · Worldwide · 2006 |
| 2008: successful (400 organisations) | 32% | IT projects reported to The Standish Group's CHAOS research (400 organizations surveyed for the 2009 summary, per CIO.com) · Worldwide · 2008 |
| 2008: challenged | 44% | IT projects reported to The Standish Group's CHAOS research (400 organizations surveyed for the 2009 summary, per CIO.com) · Worldwide · 2008 |
| 2008: failed | 24% | IT projects reported to The Standish Group's CHAOS research (400 organizations surveyed for the 2009 summary, per CIO.com) · Worldwide · 2008 |
| 2010: successful (CHAOS Manifesto 2013) | 37% | Projects in The Standish Group's CHAOS database (per reporting period 60% US, 25% European, 15% rest of world; respondents are CIOs, VPs, directors and PMO project managers) · Worldwide · 2010 |
| 2010: failed | 21% | Projects in The Standish Group's CHAOS database (per reporting period 60% US, 25% European, 15% rest of world; respondents are CIOs, VPs, directors and PMO project managers) · Worldwide · 2010 |
| 2012: successful (CHAOS Manifesto 2013) | 39% | Projects in The Standish Group's CHAOS database (per reporting period 60% US, 25% European, 15% rest of world; respondents are CIOs, VPs, directors and PMO project managers) · Worldwide · 2012 |
| 2012: failed | 18% | Projects in The Standish Group's CHAOS database (per reporting period 60% US, 25% European, 15% rest of world; respondents are CIOs, VPs, directors and PMO project managers) · Worldwide · 2012 |
| FY2011: successful, modern definition (2015 report, new database) | 29% | Software projects in The Standish Group's new CHAOS database, fiscal years 2011 to 2015 (25,000-plus projects, about 5,000 per year) · Worldwide · FY2011 |
| FY2012: successful, modern definition | 27% | Software projects in The Standish Group's new CHAOS database, fiscal years 2011 to 2015 (25,000-plus projects, about 5,000 per year) · Worldwide · FY2012 |
| FY2013: successful, modern definition | 31% | Software projects in The Standish Group's new CHAOS database, fiscal years 2011 to 2015 (25,000-plus projects, about 5,000 per year) · Worldwide · FY2013 |
| FY2014: successful, modern definition | 28% | Software projects in The Standish Group's new CHAOS database, fiscal years 2011 to 2015 (25,000-plus projects, about 5,000 per year) · Worldwide · FY2014 |
| FY2015: successful, traditional definition | 36% | Software projects in The Standish Group's new CHAOS database, fiscal years 2011 to 2015 (25,000-plus projects, about 5,000 per year) · Worldwide · FY2015 |
| FY2015: successful, modern definition | 29% | Software projects in The Standish Group's new CHAOS database, fiscal years 2011 to 2015 (25,000-plus projects, about 5,000 per year) · Worldwide · FY2015 |
| FY2015: challenged, modern definition | 52% | Software projects in The Standish Group's new CHAOS database, fiscal years 2011 to 2015 (25,000-plus projects, about 5,000 per year) · Worldwide · FY2015 |
| FY2015: failed, modern definition | 19% | Software projects in The Standish Group's new CHAOS database, fiscal years 2011 to 2015 (25,000-plus projects, about 5,000 per year) · Worldwide · FY2015 |
| 2020: successful (paywalled report, via ACM Queue) | 31% | Projects in The Standish Group's CHAOS database as reported in CHAOS 2020: Beyond Infinity (over 50,000 project profiles from the previous five years, per Henny Portman's review of the report) · Worldwide · 2020 |
| 2020: challenged | 50% | Projects in The Standish Group's CHAOS database as reported in CHAOS 2020: Beyond Infinity (over 50,000 project profiles from the previous five years, per Henny Portman's review of the report) · Worldwide · 2020 |
| 2020: failed | 19% | Projects in The Standish Group's CHAOS database as reported in CHAOS 2020: Beyond Infinity (over 50,000 project profiles from the previous five years, per Henny Portman's review of the report) · Worldwide · 2020 |

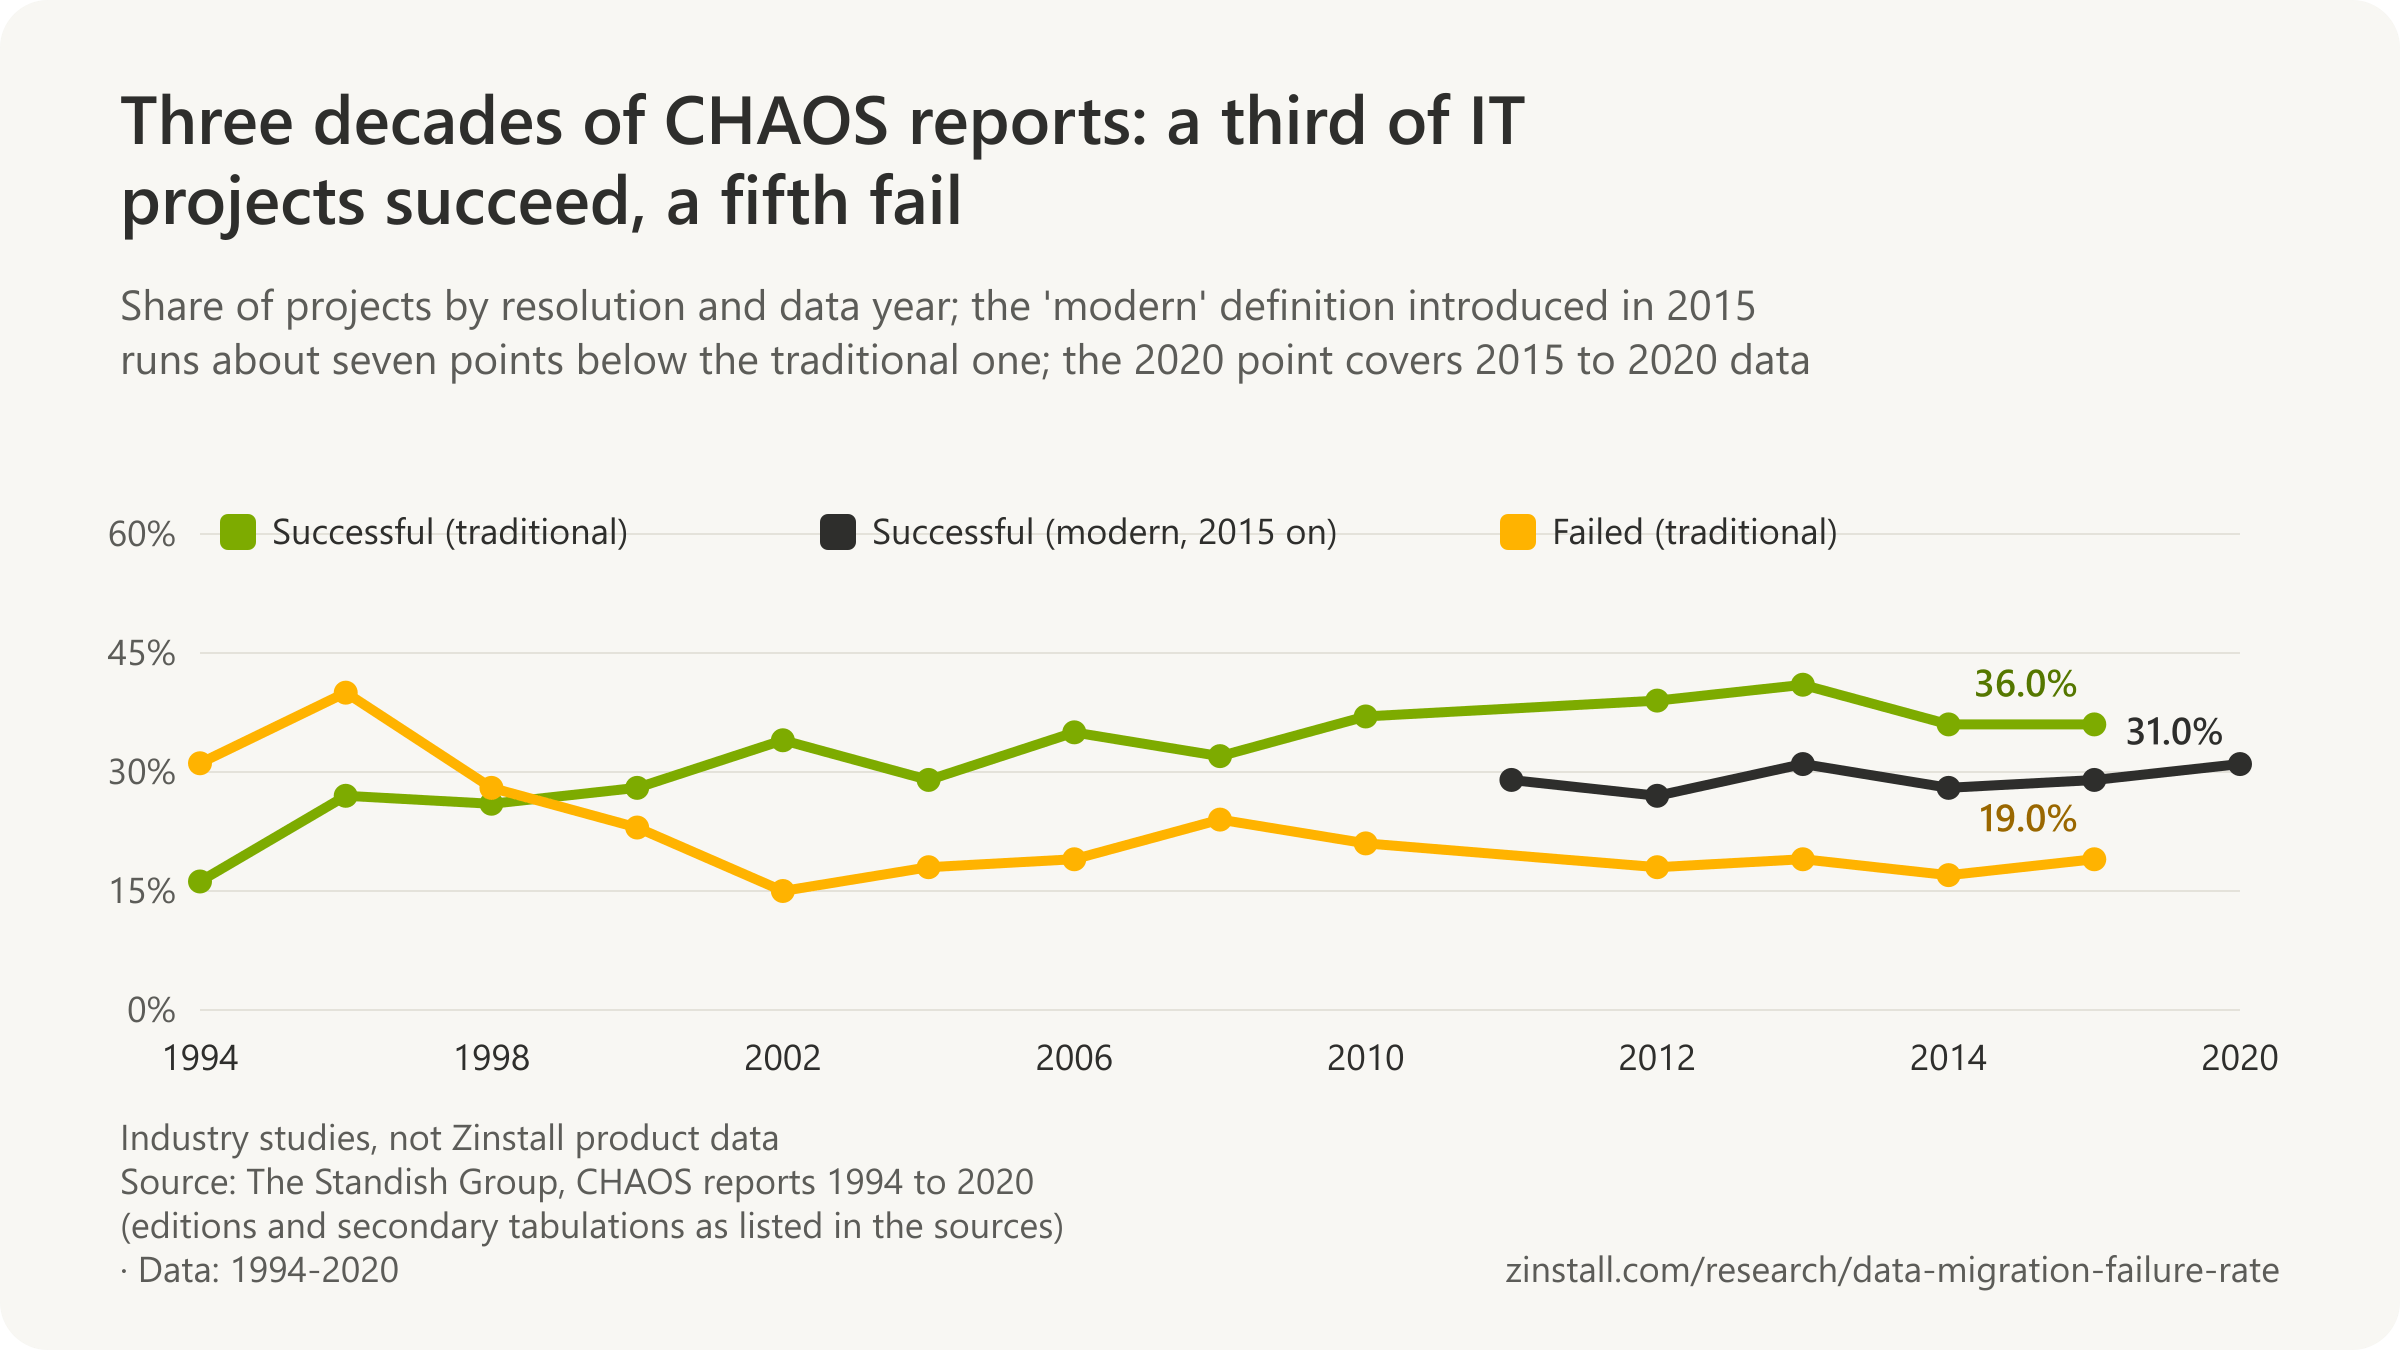
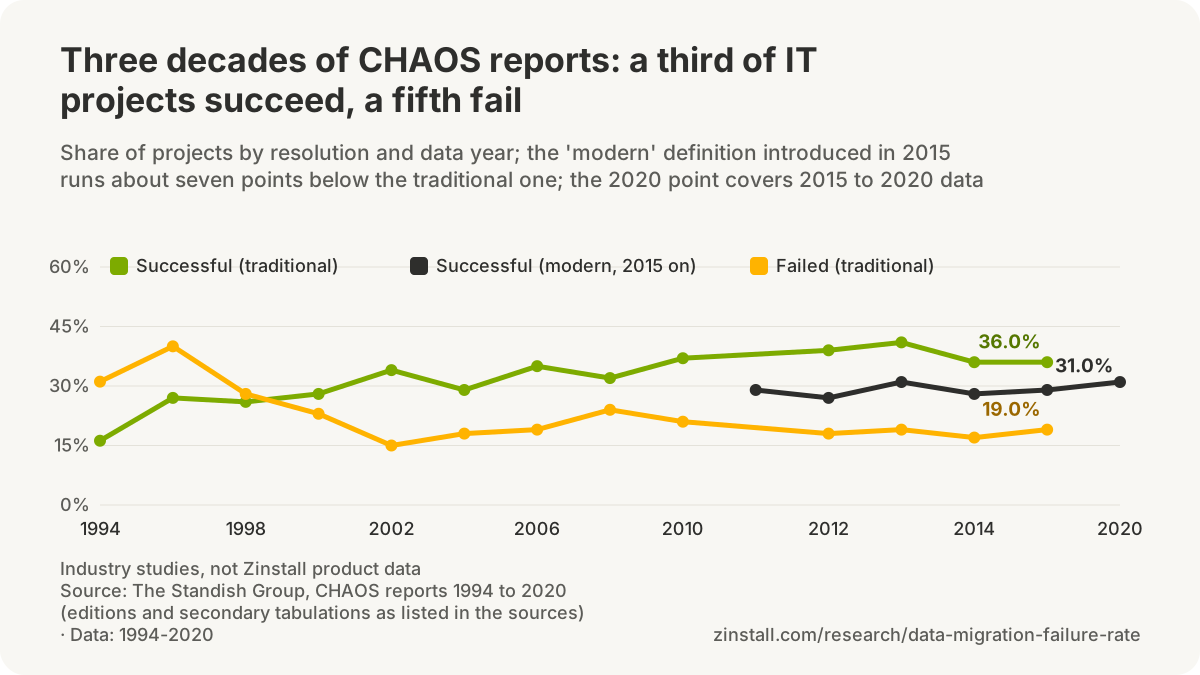
| Study, year, sample and measure | Figure | Scope |
|---|---|---|
| 2012, McKinsey and Oxford, over 5,400 projects over $15 million: average cost overrun | 45% | Large IT projects (initial budgets above $15 million) in the McKinsey and University of Oxford (BT Centre for Major Programme Management) database of more than 5,400 IT projects, as of June 2012 · Worldwide · 2012 |
| 2012, McKinsey and Oxford: average schedule overrun | 7% | Large IT projects (initial budgets above $15 million) in the McKinsey and University of Oxford (BT Centre for Major Programme Management) database of more than 5,400 IT projects, as of June 2012 · Worldwide · 2012 |
| 2012, McKinsey and Oxford: shortfall in delivered value | 56% | Large IT projects (initial budgets above $15 million) in the McKinsey and University of Oxford (BT Centre for Major Programme Management) database of more than 5,400 IT projects, as of June 2012 · Worldwide · 2012 |
| 2012, McKinsey and Oxford: projects that became black swans | 17% | Large IT projects (initial budgets above $15 million) in the McKinsey and University of Oxford (BT Centre for Major Programme Management) database of more than 5,400 IT projects, as of June 2012 · Worldwide · 2012 |
| 2011, Flyvbjerg and Budzier, 1,471 projects: average cost overrun | 27% | 1,471 IT change projects (ERP, management information, CRM systems; 92% public agencies, 83% US-based; average cost $167 million) in the Oxford BT Centre for Major Programme Management database · Worldwide · 2011 |
| 2011, Flyvbjerg and Budzier: projects that were black swans | 1 in 6 | 1,471 IT change projects (ERP, management information, CRM systems; 92% public agencies, 83% US-based; average cost $167 million) in the Oxford BT Centre for Major Programme Management database · Worldwide · 2011 |
| 2011, Flyvbjerg and Budzier: average cost overrun of the black swans | 200% | 1,471 IT change projects (ERP, management information, CRM systems; 92% public agencies, 83% US-based; average cost $167 million) in the Oxford BT Centre for Major Programme Management database · Worldwide · 2011 |
| 2022, Flyvbjerg and others, 5,392 projects: mean ratio of actual to estimated cost | 1.8x | 5,392 IT projects completed between 2002 and 2014 in 66 countries, public and private sector, total cost $56.5 billion (2015 USD); 4,677 with both estimated and actual cost · Worldwide · 2002-2014 |
| 2020, BCG, digital transformations: falling short of objectives | 70% | Digital transformations rated by 825 senior executives in BCG's survey, plus BCG's work with 70 companies · Worldwide · 2020 |
| 2021, PMI Pulse of the Profession: project investment wasted | 9.4% | Project management practitioners and leaders worldwide surveyed for PMI's Pulse of the Profession 2021 (3,950 project professionals respondents) · Worldwide · 2021 |
| 2021, PMI: projects meeting original goals | 73% | Project management practitioners and leaders worldwide surveyed for PMI's Pulse of the Profession 2021 (3,950 project professionals respondents) · Worldwide · 2021 |
| 2019, KPMG, AIPM and IPMA: delivering successful projects most of the time | 19% | Almost 500 project management practitioners from 57 countries surveyed by KPMG, AIPM and IPMA in 2019 · Worldwide · 2019 |
| 2017, KPMG New Zealand: consistently delivering on benefits | 21% | 188 respondents (project professionals, senior executives and business representatives) in KPMG New Zealand's Project Management Survey 2017 · New Zealand · 2017 |
| FY2008, US GAO, major federal IT projects: poorly planned or poorly performing | 53% | Major federal IT projects of the 24 major US agencies, fiscal year 2008 (778 major projects; 810 projects with a $70.7 billion budget planned for fiscal 2009) · United States · FY2008 |
| 2010 to 2013, Panorama, ERP projects: over budget | 54% | 192 respondents to Panorama Consulting's web survey on ERP implementations, January 2013 to February 2014 · Worldwide · 2010-2013 |
| 2010 to 2013, Panorama, ERP projects: over planned duration | 72% | 192 respondents to Panorama Consulting's web survey on ERP implementations, January 2013 to February 2014 · Worldwide · 2010-2013 |
| 2005, Cutter Consortium, software projects: failing budget targets | 50% | Software projects at more than 200 organizations and 232 recently completed projects worldwide, surveyed by Cutter Consortium in 2005 · Worldwide · 2005 |
| Survey, year and measure | Figure | Scope |
|---|---|---|
| 2002, KPMG (via Information Age): businesses with a failed IT project in the past 12 months | 56% | Dozens of public companies worldwide surveyed by KPMG in 2002, as reported by Information Age · Worldwide · 2002 |
| 2002, Information Age's headline for the same survey: 'of IT projects fail' | 56% | Information Age's wording of KPMG's 2002 survey of public companies · Worldwide · 2002 |
| 2003, KPMG (as restated in 2005 coverage): organisations with a project failure in the prior year | 57% | Organisations surveyed in KPMG's 2003 programme management survey, as restated by ITWire · Worldwide · 2003 |
| 2005, KPMG global survey, over 600 organisations in 22 countries: at least one project failure in the past year | nearly half | More than 600 organisations across 22 countries surveyed by KPMG (Global IT Project Management Survey 2005) · Worldwide · 2005 |
| 2005 to 2008, KPMG Hong Kong brochure: participants with a project failure in the past 12 months | 49% | Participants in a recent KPMG project management survey, as quoted by KPMG Hong Kong (the 2005 global survey's figure) · Worldwide · 2005-2008 |
| 2010, KPMG New Zealand: organisations with at least one project failure in the previous year | more than two-thirds | New Zealand organisations in KPMG New Zealand's 2010 Project Management Survey (about 100 companies per press coverage) · New Zealand · 2010 |
| 2010, KPMG New Zealand (via Computerworld): projects successful | about half | New Zealand organisations' projects in KPMG's 2010 survey, as restated by the 2013 study author · New Zealand · 2010 |
| 2012 data, KPMG New Zealand, 208 organisations: consistently delivering on budget (48% in 2010) | 33% | 208 New Zealand organisations in KPMG New Zealand's biennial Project Management Survey 2013 (data for the 12 months to September 2012) · New Zealand · 2012 |
| 2012 data, KPMG New Zealand: consistently delivering on time (36% in 2010) | 29% | 208 New Zealand organisations in KPMG New Zealand's biennial Project Management Survey 2013 (data for the 12 months to September 2012) · New Zealand · 2012 |
| 2012 data, KPMG New Zealand (via interest.co.nz): projects that failed | 2 in 3 | 208 New Zealand organisations in KPMG's 2013 survey, as reported by interest.co.nz · New Zealand · 2012 |
| 2017, KPMG New Zealand, 188 respondents: likely to deliver on budget (31% on time) | 29% | 188 respondents (project professionals, senior executives and business representatives) in KPMG New Zealand's Project Management Survey 2017 · New Zealand · 2017 |
| 2017, KPMG New Zealand: consistently delivering on benefits | 21% | 188 respondents (project professionals, senior executives and business representatives) in KPMG New Zealand's Project Management Survey 2017 · New Zealand · 2017 |
| 2019, KPMG, AIPM and IPMA: likely to deliver on time (36% on budget) | 30% | Almost 500 project management practitioners from 57 countries surveyed by KPMG, AIPM and IPMA in 2019 · Worldwide · 2019 |
| 2019, KPMG, AIPM and IPMA: delivering successful projects most of the time | 19% | Almost 500 project management practitioners from 57 countries surveyed by KPMG, AIPM and IPMA in 2019 · Worldwide · 2019 |

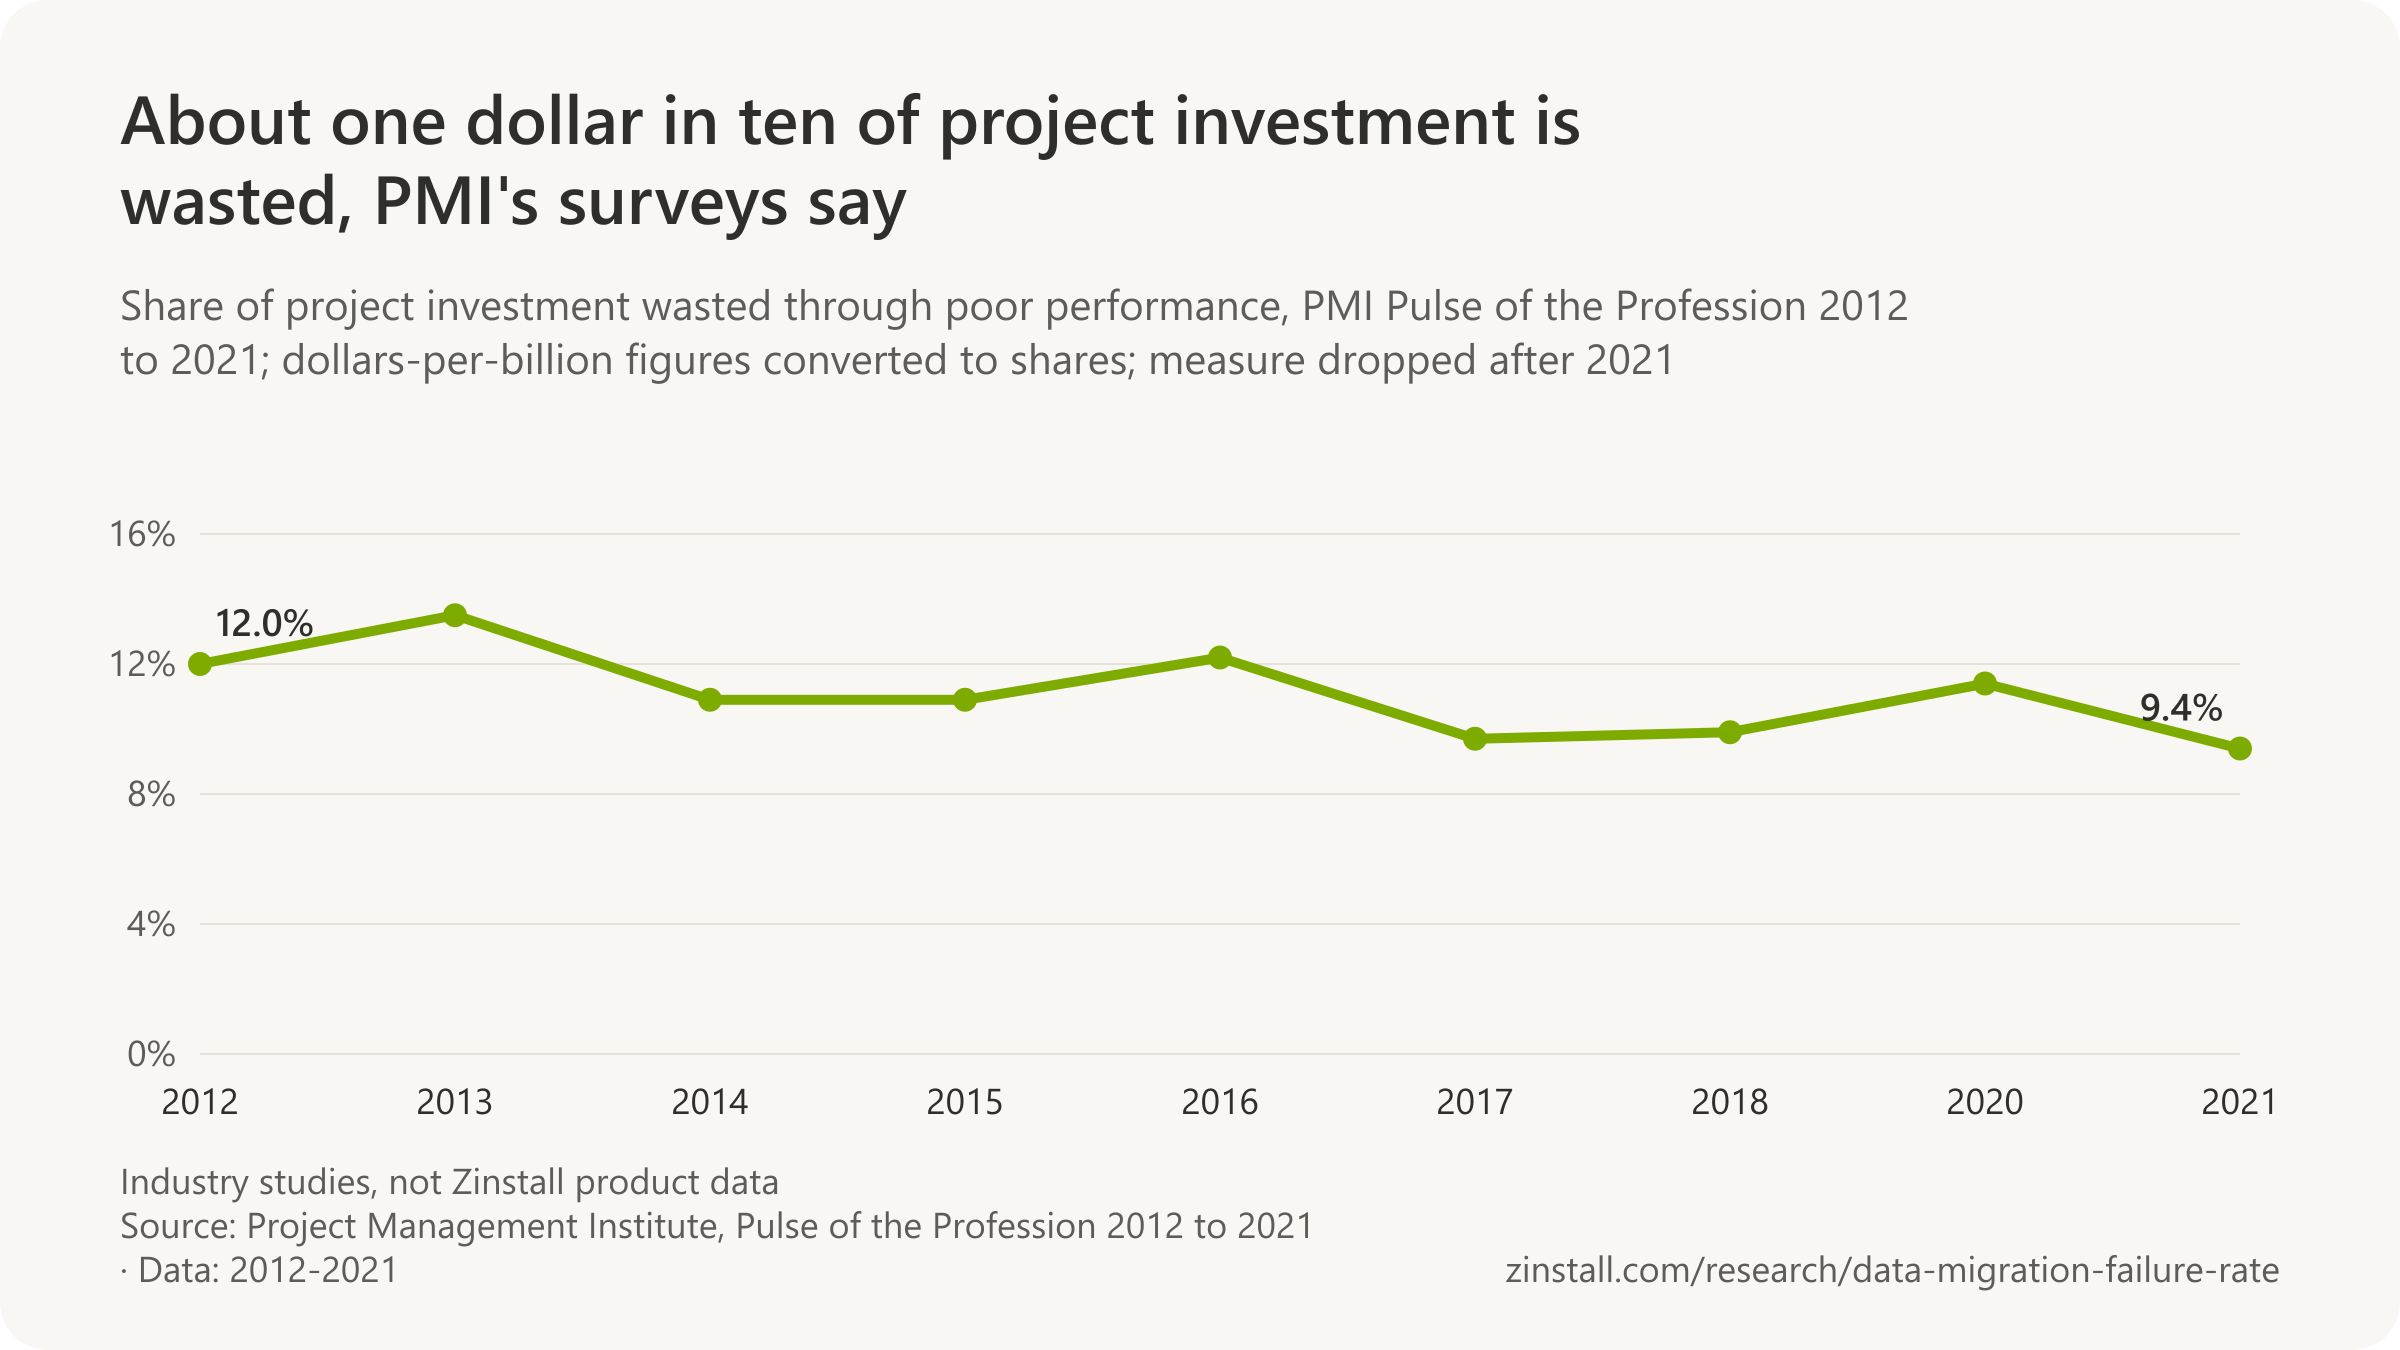
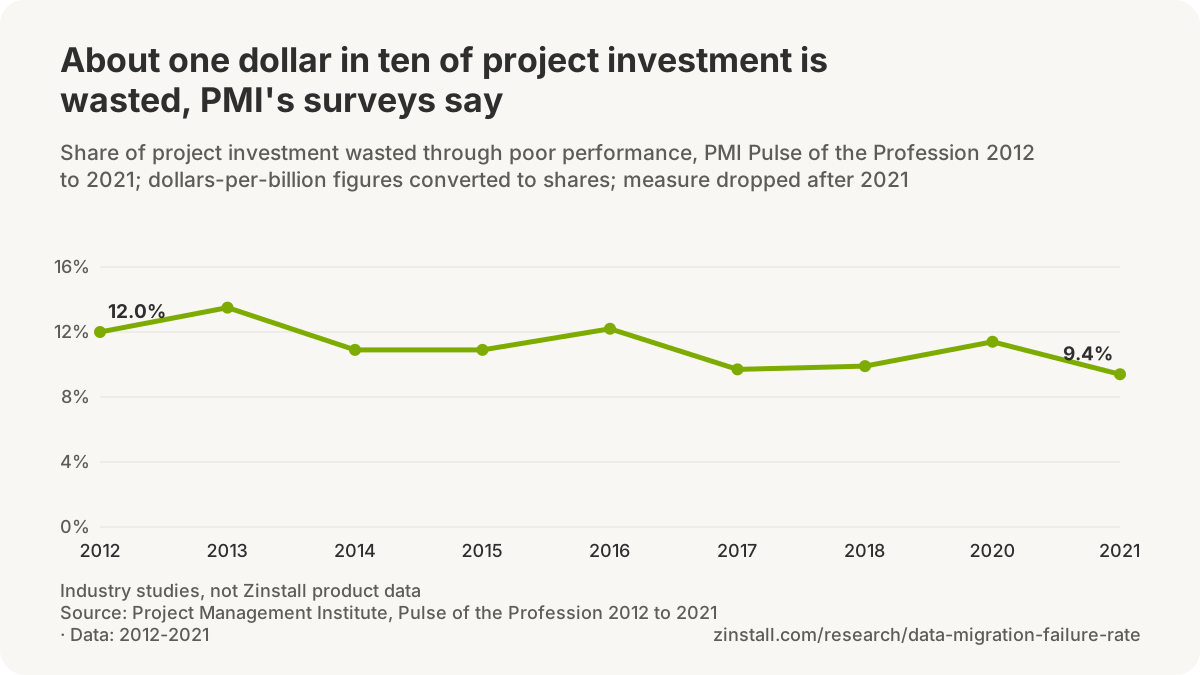
Sources: Harvard Business Review; ACM Queue; The Standish Group (1994-2015); McKinsey and Company with the University of Oxford; Journal of Management Information Systems; Boston Consulting Group; Project Management Institute (2013-2021); KPMG, AIPM and IPMA; Information Age; Gartner (2001, 2024); CRM Magazine; Rand Group; Communications of the ACM; Information and Software Technology; IEEE Software; U.S. Government Accountability Office; CIO.com; KDnuggets; KPMG New Zealand (2013, 2017); Panorama Consulting Solutions; Cutter Consortium; ITWire; KPMG; Computerworld New Zealand; interest.co.nz
Data. All 712 statistics on this page, each with its source, verbatim quote and locator: CSV · JSON. Charts and figures on this page may be reused with a link to https://www.zinstall.com/research/data-migration-failure-rate as the source. Original publishers retain attribution.
Data behind each chart (CSV, 16 files)
- Three decades of CHAOS reports: a third of IT projects succeed, a fifth fail
- Cloud buyers have put their own waste at about three in ten dollars for a decade
- Public cloud budgets ran over by 13% to 24% a year, on average
- About one dollar in ten of project investment is wasted, PMI's surveys say
- Nine in ten enterprises now put an hour of downtime above $300,000
- One outage in five now costs over $1 million, on small survey bases
- Organisations suspect about a quarter to a third of their own data is wrong
- AWS counted 350,000 databases migrated with its service in under five years
- WordPress lost about three points of the web in a year
- Half of IT professionals reported a migration failure by 2016, up from a third
- Managing cloud spend has led Flexera's list of cloud challenges for four years
- The data migration failure rate depends on the survey: from 38% to 84% ran over or had problems
- Application compatibility has topped the list of Windows migration barriers for fifteen years
- At every server end of support, a fifth to three fifths are still on the old version
- A mature deployment process halves the cost of a PC migration: $795 to $373 per PC
- Only about a third of software projects succeed outright, three decades of CHAOS reports say
Methodology
What we included. Scope: every figure on this page describes migration projects across the industry, as measured by independent studies, vendor surveys and audits; none measures transfers made with Zinstall's products, and the page publishes no Zinstall success or failure rate. This page collects every survey of data migration project outcomes we could fetch (Bloor Research 2007 and 2011 and its white papers, the Information Architecture Team 2002, Experian and Data Migration Pro, Vision Solutions, WANdisco and Unisphere, Horvath, ISG, Xmateria, Caylent, Precisely), the restatement chain of the '83% (Gartner)' claim with every dated appearance we found, Gartner's own published figures on related subjects, the cloud surveys (Flexera and RightScale by edition, Unisys, Accenture, IDC, Barclays via trade press, IHS Markit for Fortinet, Nutanix, Gartner forecasts, Andreessen Horowitz, 37signals), the PC and operating-system migration surveys and tests (Symantec, Cloudhouse, Microsoft App Assure, IDC for Dell, Techaisle, Principled Technologies, Which?, Kroll Ontrack, Adaptiva, Ivanti, Spiceworks, Dell, Panasonic, ControlUp, Nexthink, Lansweeper, HP), the server, database and website figures (Spiceworks, Lansweeper, Rapid7, Microsoft documentation, AWS, Microsoft Azure, EDB, W3Techs, Liquid Web, Duplicator, Google, BitTitan, ITIC, Uptime Institute, Ponemon), and the IT-project comparators (Standish CHAOS by edition, McKinsey and Oxford, Flyvbjerg and Budzier, BCG, PMI, KPMG, GAO, Panorama, Cutter, and the academic critiques of Standish). Official statistics, the trackers' own publications, company filings and transcripts, and peer-reviewed or analyst reports are preferred; vendor surveys and news reports are included only where no better source exists and are labelled as such in the dataset.
How each figure was verified. Every record carries the exact sentence or table cell from the source (the quote) and where it sits (the locator). A researcher confirmed each one against the source document; a script then re-fetched every source on October 13, 2026 and checked for the quote. Records the script could not confirm are kept only if the researcher's check was complete, and are marked for human review in the dataset. Restatements (a later outlet quoting an earlier figure) are recorded as restatements, with the primary figure alongside.
What we excluded. Any figure whose only source is a roundup or a vendor page citing nobody; the '83%' as a fact; McKinsey's 2021 cloud-migration estimates and Gartner's 2014 downtime figure, whose documents could not be fetched during this collection (kept in the working file as unverified, not published); market sizes beyond Gartner's and IDC's; and any average computed across surveys with different populations and definitions. Where a source gives a figure only in a form we could not confirm (for example, a chart with no data table), the record is marked unverified and is not exported.
Rounding and derivation. Numbers are reproduced as published. Where a tracker publishes two decimals, statements and table cells give one decimal, rounded half up, and the dataset keeps the published value. In the short sentences at the top of the page and of each section, large counts and money amounts may be rounded to two or three significant figures; the exact figure follows in the section's full statements and in the dataset. Derived figures (a change between two months, a share computed from two counts) say so and name their inputs. The bold figure in each statement is a reading aid, not an edit.
Updates. Sources are re-checked and new figures added quarterly, with the monthly tracker series topped up as they are published; the next scheduled refresh is January 2027. Corrections are welcome through the contact page.
The search for the Gartner document. We searched gartner.com (newsroom, research index and the public abstracts of its data-migration notes), the trade press from 2003 to 2012, Google Books and three other search engines, the Wayback Machine's index of the oldest vendor pages carrying the claim, Bloor Research's site for any citation of Gartner, and the sites of the vendors most often credited with the figure. The earliest dated appearance is a March 2005 trade-magazine interview; the only Gartner document any page names is a February 2009 research note whose public abstract carries no percentage and whose body, as quoted by three consultancies, gives none. The note itself is paywalled, so a figure in its body cannot be excluded; it would postdate the 2005 appearance by four years. The ten search paths and their outcomes are recorded in the working dataset.
Cite this page
Zinstall. "Data Migration Failure Rates (when done without Zinstall)." https://www.zinstall.com/research/data-migration-failure-rate. Updated 2026-10-15.
Frequently asked questions
Did Gartner say that 83% of data migration projects fail?
We could not find a Gartner document that says so. The earliest dated appearance of the claim is a March 2005 interview with a data migration vendor's chief executive in CXO magazine, which says 'according to Gartner' and names no document. The Gartner figure from that year that does exist is a forecast that more than 50% of data warehouse projects would have limited acceptance or fail, and the 2009 Gartner note that later pages cite carries no percentage in its public abstract. A storage vendor's survey in 2005 found 83% of migrations had problems, which is a different measure.
Do these failure rates apply to transfers made with Zinstall?
No. Every figure on this page comes from independent studies, surveys and audits of migration projects across the industry, most of them carried out with in-house approaches: three in four projects in Bloor Research's 2007 survey. None of these studies measured transfers made with Zinstall's products, and this page publishes no Zinstall success or failure rate.
What percentage of data migration projects fail or run over?
It depends on the survey and on what counts as failing. Bloor Research found 84% of projects over time or budget among 43 large companies in 2007 and 38% among a different sample in 2011. Experian and Data Migration Pro found 36% of projects kept to their original budget and 54% suffered a delay in 2017. Horvath found 8% of completed S/4HANA migrations finished on schedule in 2025, and Caylent found 6% of the hardest database migrations finished on time. None of these is a general failure rate.
Why do data migrations fail or overrun?
Poor data quality was the most cited reason for overruns in Bloor's 2011 survey, and scoping was blamed by more than two thirds of the companies with overruns in its 2007 survey. Profiling the data before estimating the project is the practice with a measured effect: 68% of projects were on schedule when the data had been profiled first, against 55% when it had not. In 2017 only 43% of projects had effective governance and 28% had no data-quality issues after migration, according to Experian and Data Migration Pro.
How often do cloud migrations go over budget?
In Flexera's State of the Cloud surveys, public cloud budgets ran over by an average of 15% in 2024 and by 13% to 24% in the five years Flexera published an average; in 2026, 17% of respondents said they had exceeded their budget, and respondents estimated 29% of their public cloud spend was wasted. In Accenture's 2020 survey 37% of companies had achieved the full value they expected from the cloud.
How long does it take to migrate a PC?
Symantec's 2010 survey of IT managers put the average at five hours to migrate one existing machine to Windows 7 and four for a fresh install. IDC's 2012 study for Dell found 1.66 IT hours to deploy a new PC on average, 2.9 at the least mature organisations. In a 2020 laboratory test for Dell, moving 100 GB between two laptops took from 50 minutes to just under three and a half hours depending on the tool. In 2017, 57% of enterprise IT respondents told Adaptiva they expected two to four hours per PC for a Windows 10 migration.
What counts as a failed data migration?
There is no shared definition, which is why the rates on this page cannot be averaged. Bloor Research counted projects that ran over time or over budget. The Standish Group's traditional definition called a project successful only if it finished on time, on budget and with all specified features, and its 2015 'modern' definition replaced the feature test with a satisfactory result, cutting the success rate by about seven points. Vision Solutions asked IT professionals whether they had experienced a migration failure of any kind, Experian and Data Migration Pro asked whether projects kept to budget or suffered a delay, and Kroll Ontrack counted organisations that lost data on the way.
Which sources should I cite for data migration failure rates?
Cite the survey, its year and its sample rather than a bare percentage: Bloor Research's 2007 survey (84% over time or budget, 43 Global 2000 companies) and 2011 survey (38%, provisional, different sample); Experian and Data Migration Pro's 2017 study of 270 practitioners; for cloud, Flexera's State of the Cloud by edition; for IT projects in general, the Standish Group's CHAOS reports with their 2015 change of definition noted. Avoid '83% (Gartner)' unless you have the document, which we could not find.
Sources: CXO magazine; Gartner (2005, 2009); IBM Global Technology Services; BCS; Bloor Research; Experian / Data Migration Pro (2017, 2018); CIO; Caylent; eWeek; Flexera (2024, 2026); Accenture; Symantec; IDC; Principled Technologies (2020); Adaptiva; The Standish Group; Nextgov; Kroll Ontrack
Ready to transfer your programs and files?
Sources
Every source document behind the figures on this page, listed by publisher. The sources line under each section links each publisher to its document, and the dataset carries the verbatim quote and locator for every statistic.
Show all 301 sources
Loading the list of sources. It is also published as a file: JSON.
guaranteeAny PC, any Windows Buy now